

Creating monitors
Adding monitors
Metaplane supports adding monitors at both the database and table level. You can add monitors by clicking into your data warehouse from the left hand sidebar, and selecting the database(s) and/or table(s) you'd like to add monitors to. Locate the *Add Monitors button on the top right hand corner to get started.
- At the database and schema level, you'll see a full list of tables that you can add freshness, column count, row count, or custom SQL monitors to. You can select all tables with the checkbox next to the filter search to bulk add monitors.
- At the table level, you'll be able to apply any of the monitor types that Metaplane supports.
After creating a monitor, Metaplane will begin collecting the metadata and training our models immediately. The training period can be as little as 3 days.
Changing monitor frequency
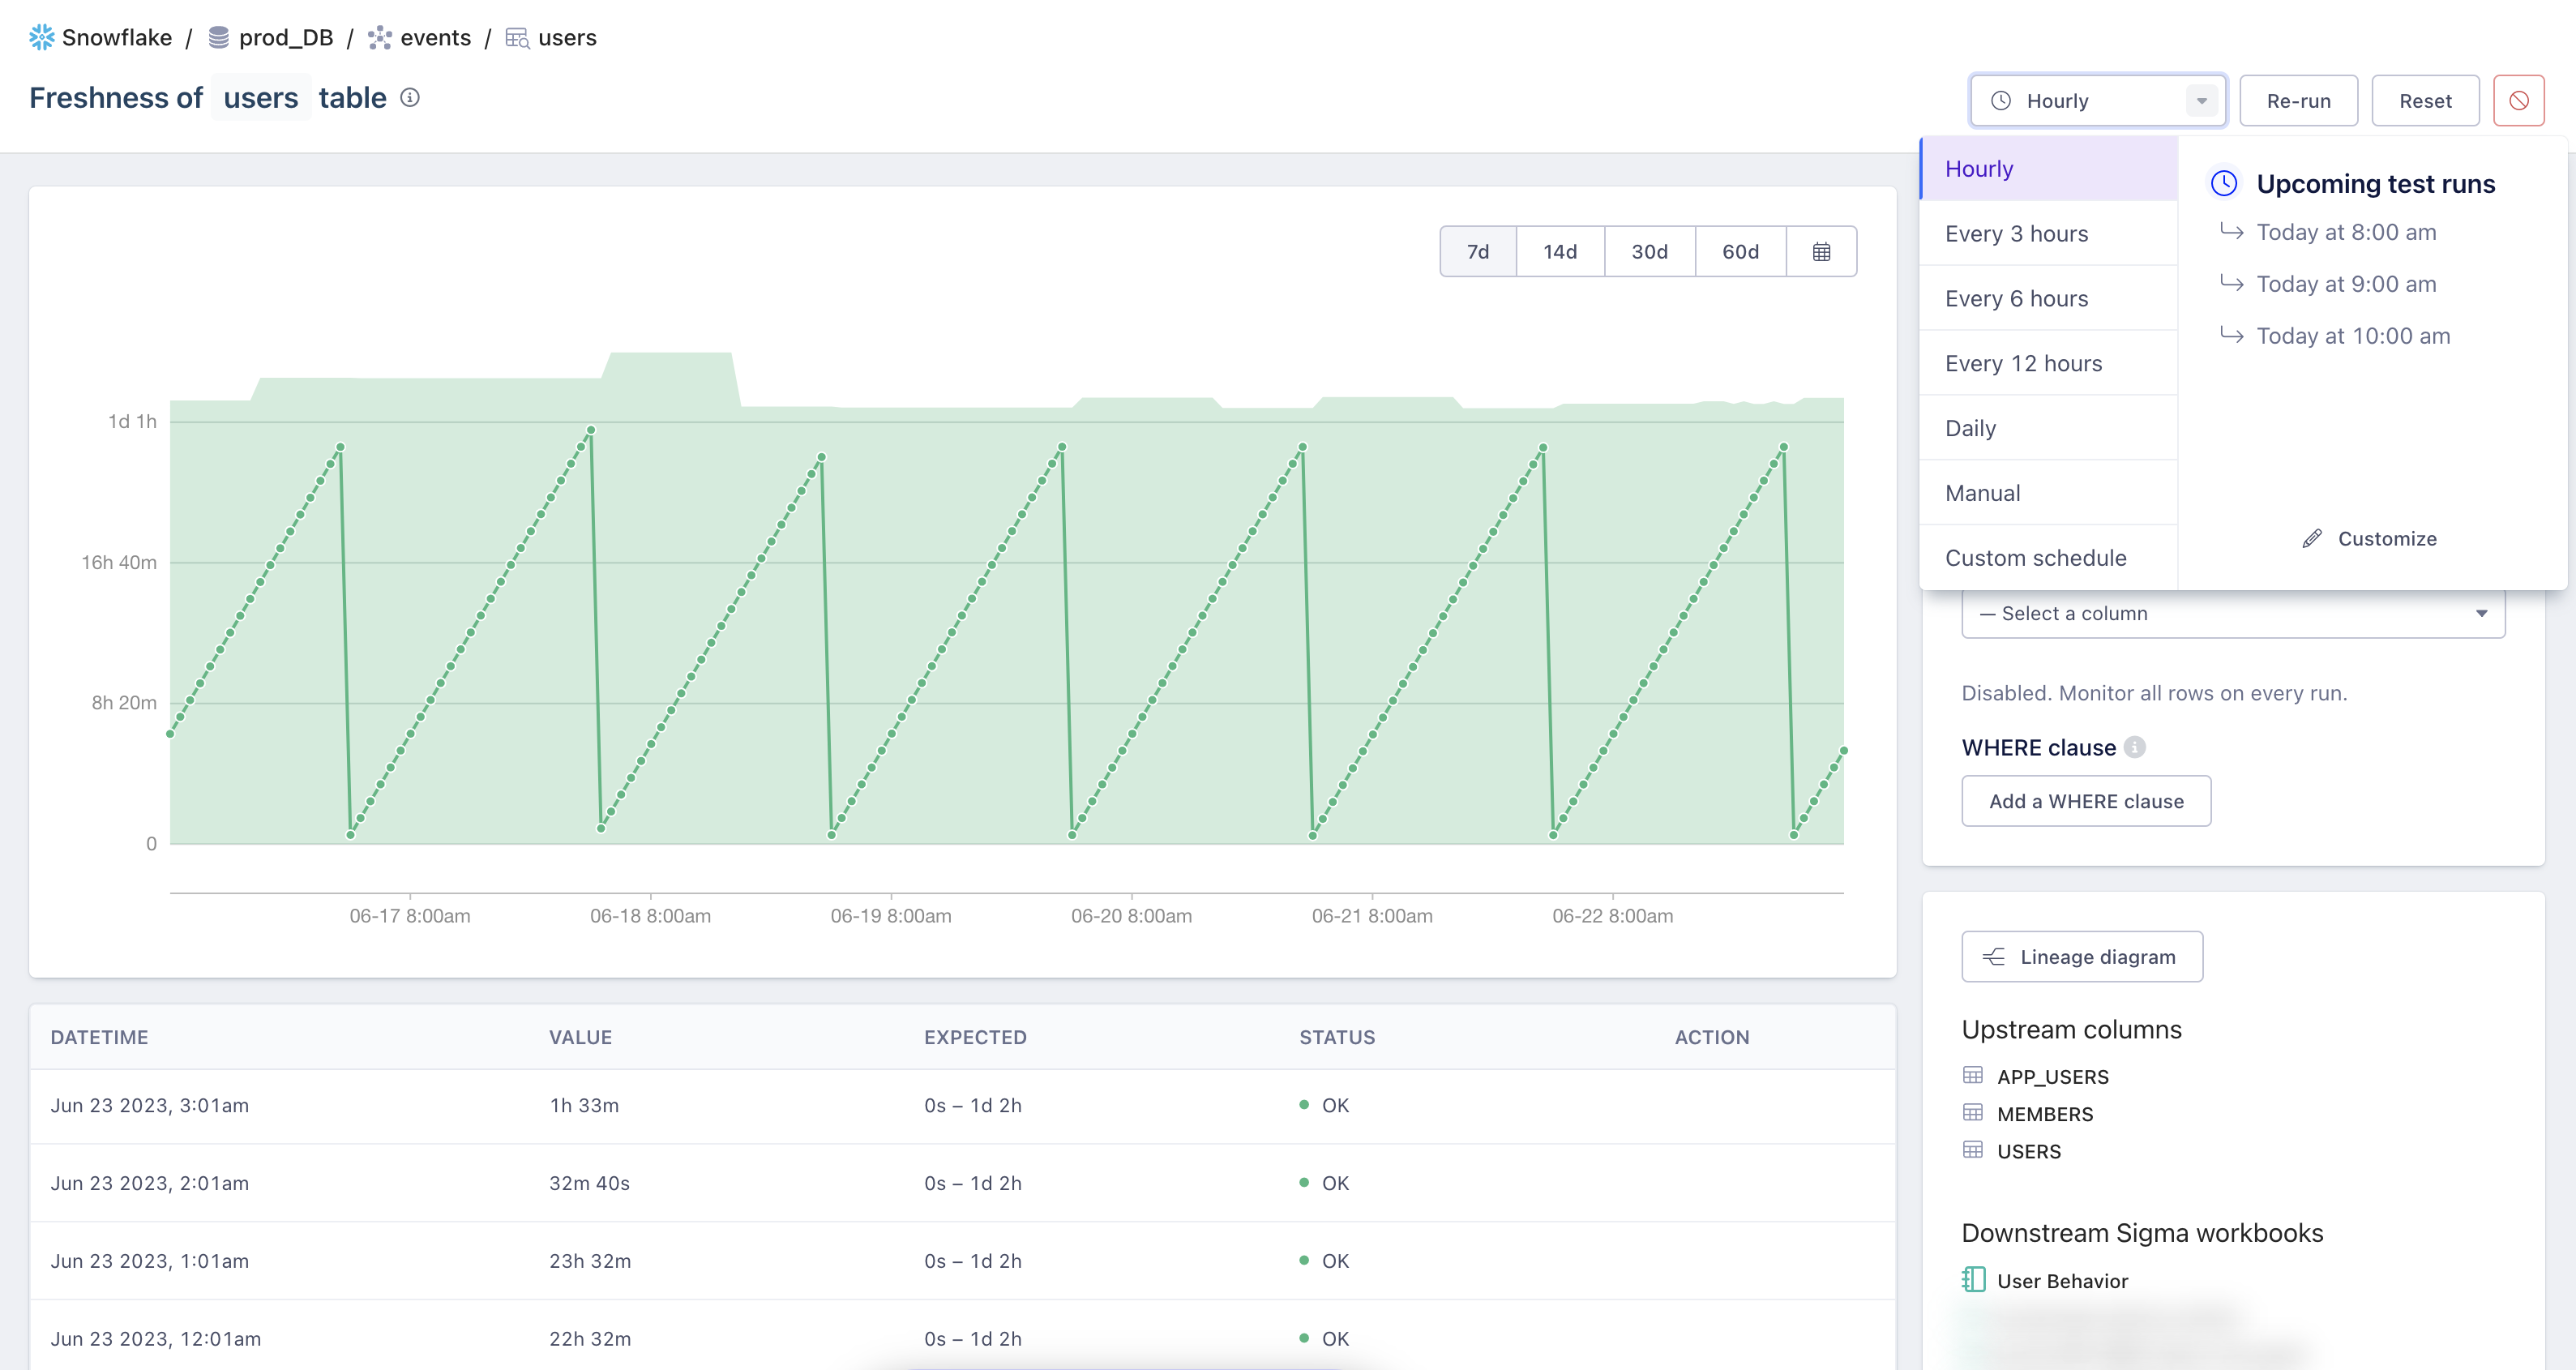
Monitors are run each hour by default. By clicking into a monitor page, you can change the frequency through the dropdown on the top right corner:
Where to begin placing monitors (monitor suggestions)
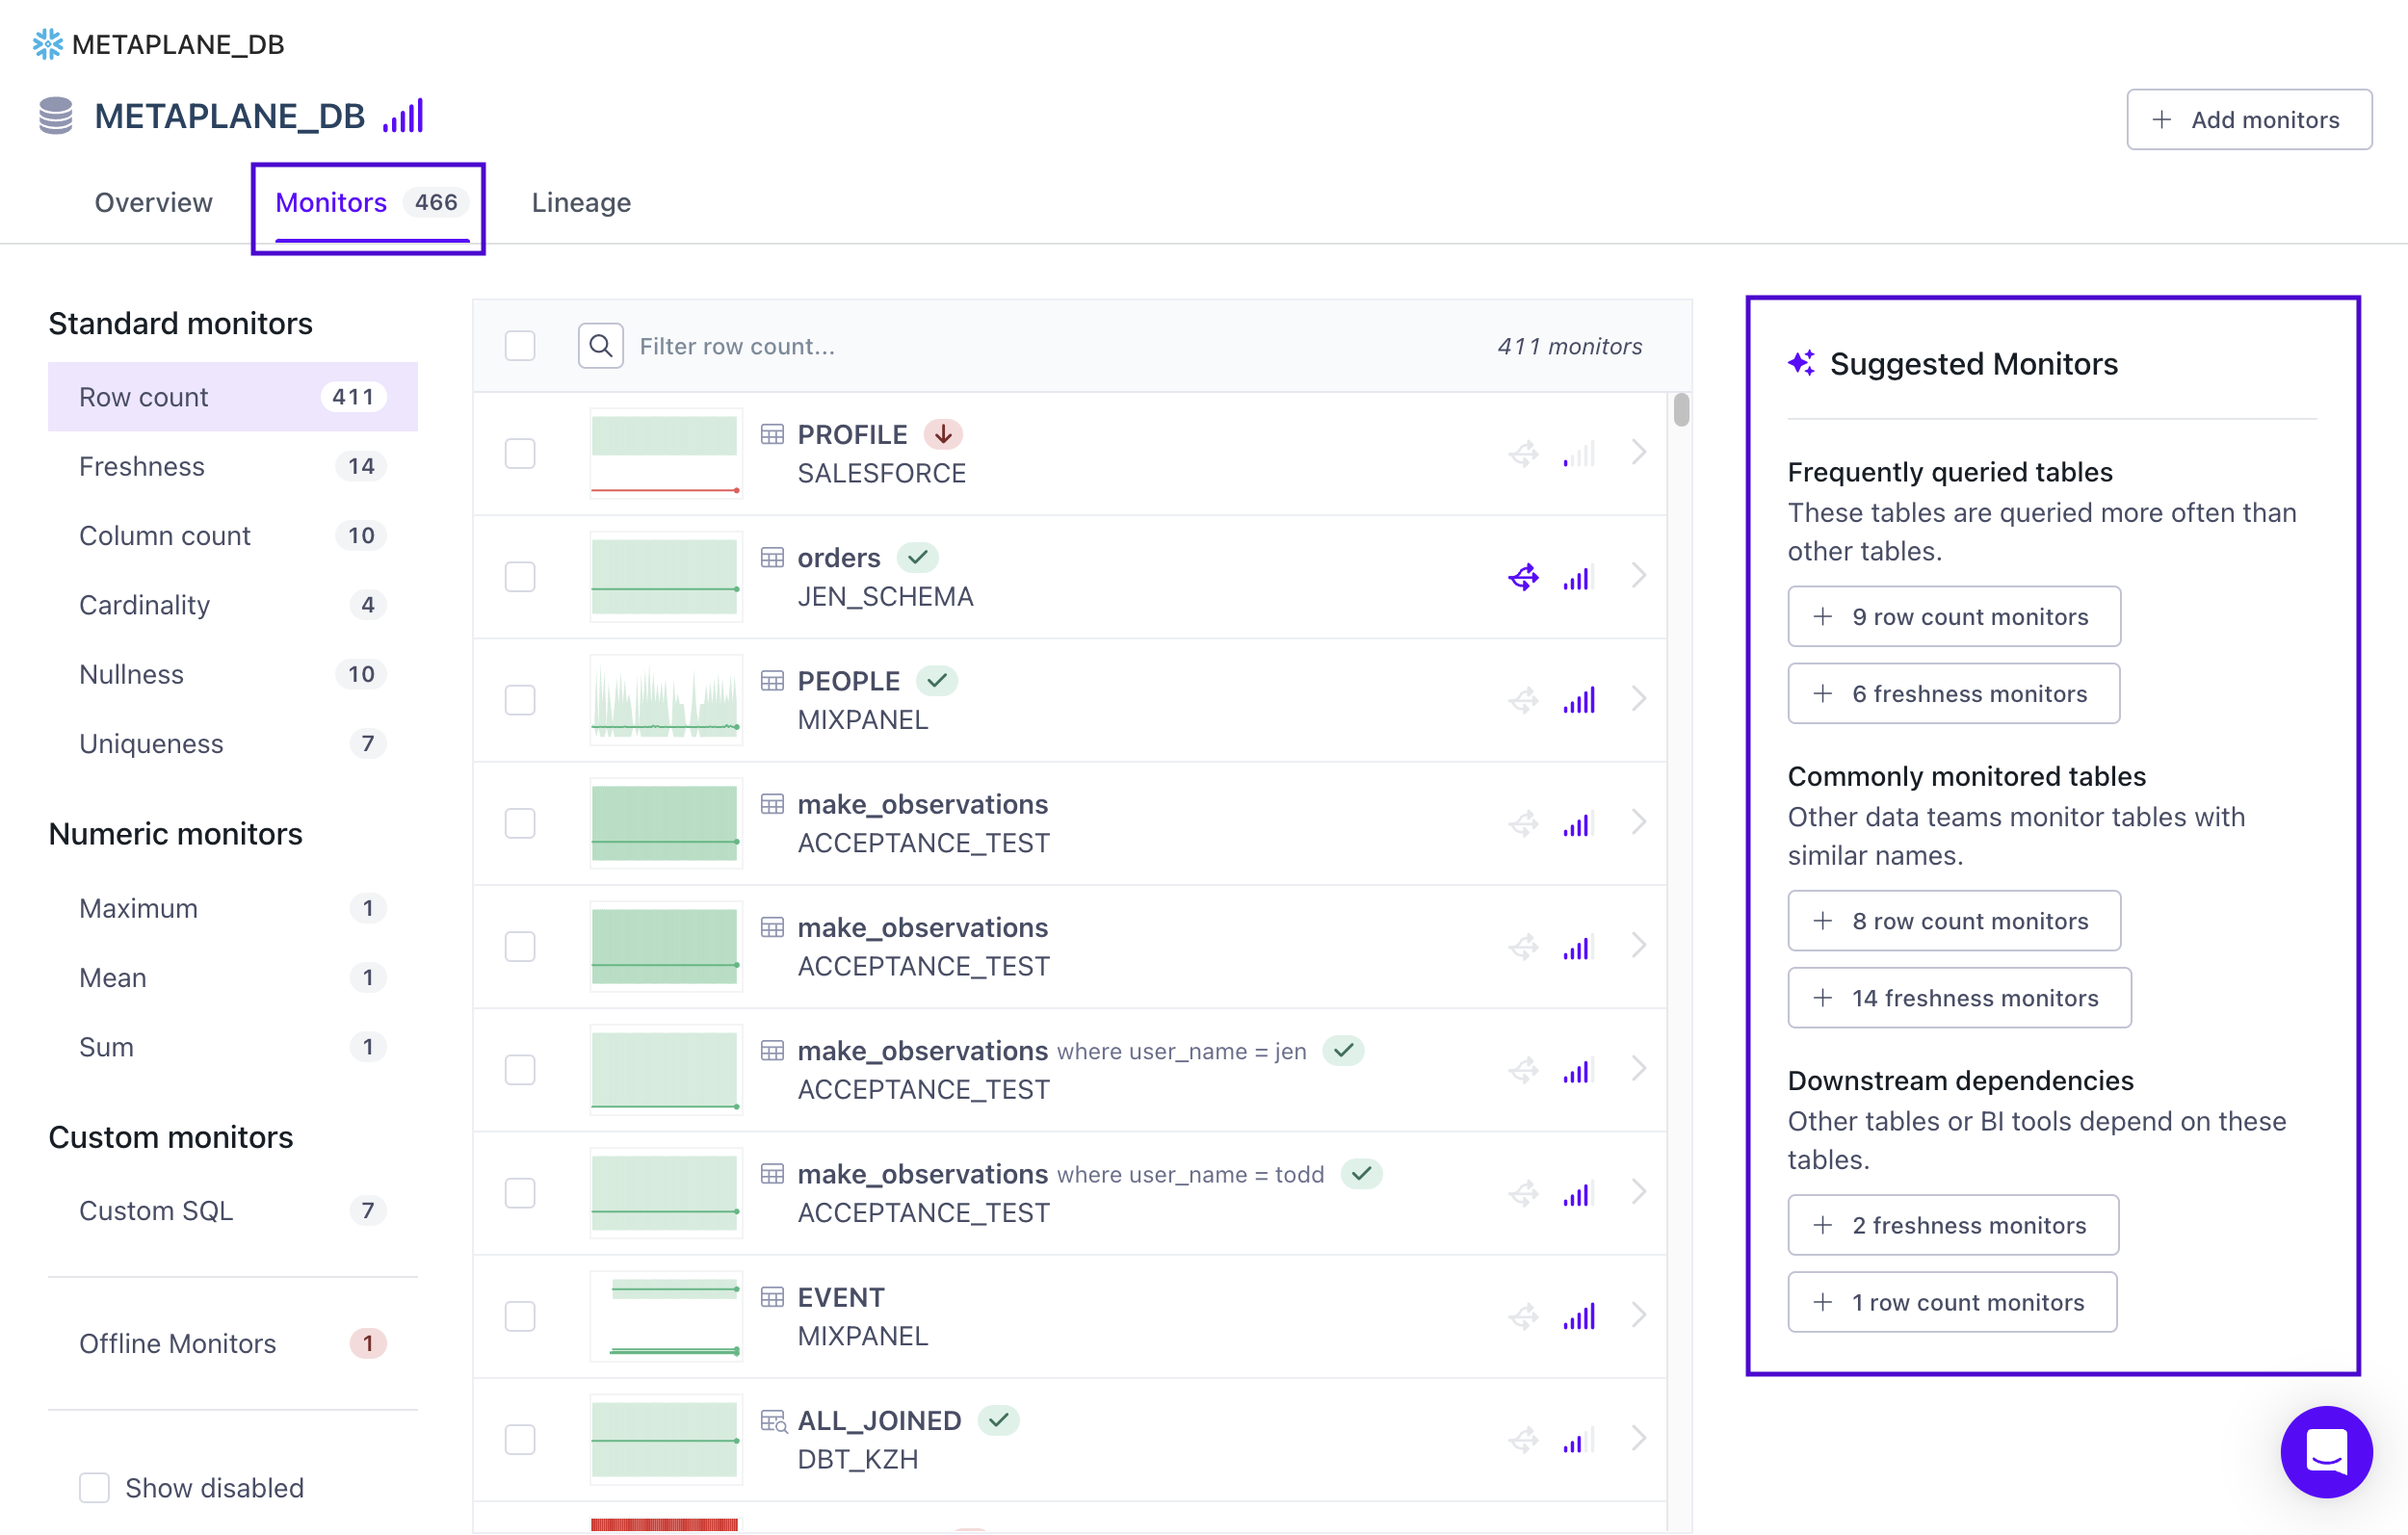
We recommend starting with Freshness and Volume monitors, as stale data or a shift in the change in row count are common early indicators that there's a data quality issue present. If you navigate to the database object in the Metaplane UI, and then click on the "Monitors" tab, you'll be able to a curated recommendation list of where to automatically place monitors, based on usage.
We recommend placing these monitors, which efficiently use metadata, on your "landing zones" (i.e. tables that you load data into) and "curated tables" (i.e. tables that sit closest to your data product(s)). If you're looking for tactical advice, based on what other customers are doing, or just a sounding board, our team is always available to chat!
Bulk monitor creation
You'll be able to create multiple monitors in once either through the API or through the UI as shown below. Using the UI to bulk create monitors follows the same process as creating a single monitor.
Updated about 1 year ago
What’s Next
After creating your monitors, they'll automatically begin training to determine alerts. If you do want to provide manual input with unique business constraints, you can do so with monitor configuration options.