

dbt Job Duration Monitors
With the dbt job duration monitors, you'll be able to get an overview of how long your dbt jobs take to run and be alerted to jobs that take longer than usual to process. If you're familiar with the other Metaplane monitor types, you can think of this as Freshness for your dbt jobs. Monitoring for dbt job durations is useful as a leading indicator of potential data quality issues, particularly in cases where you have latency dependencies or a need for up-to-date data (i.e. real-time or near real-time).
Creating monitors
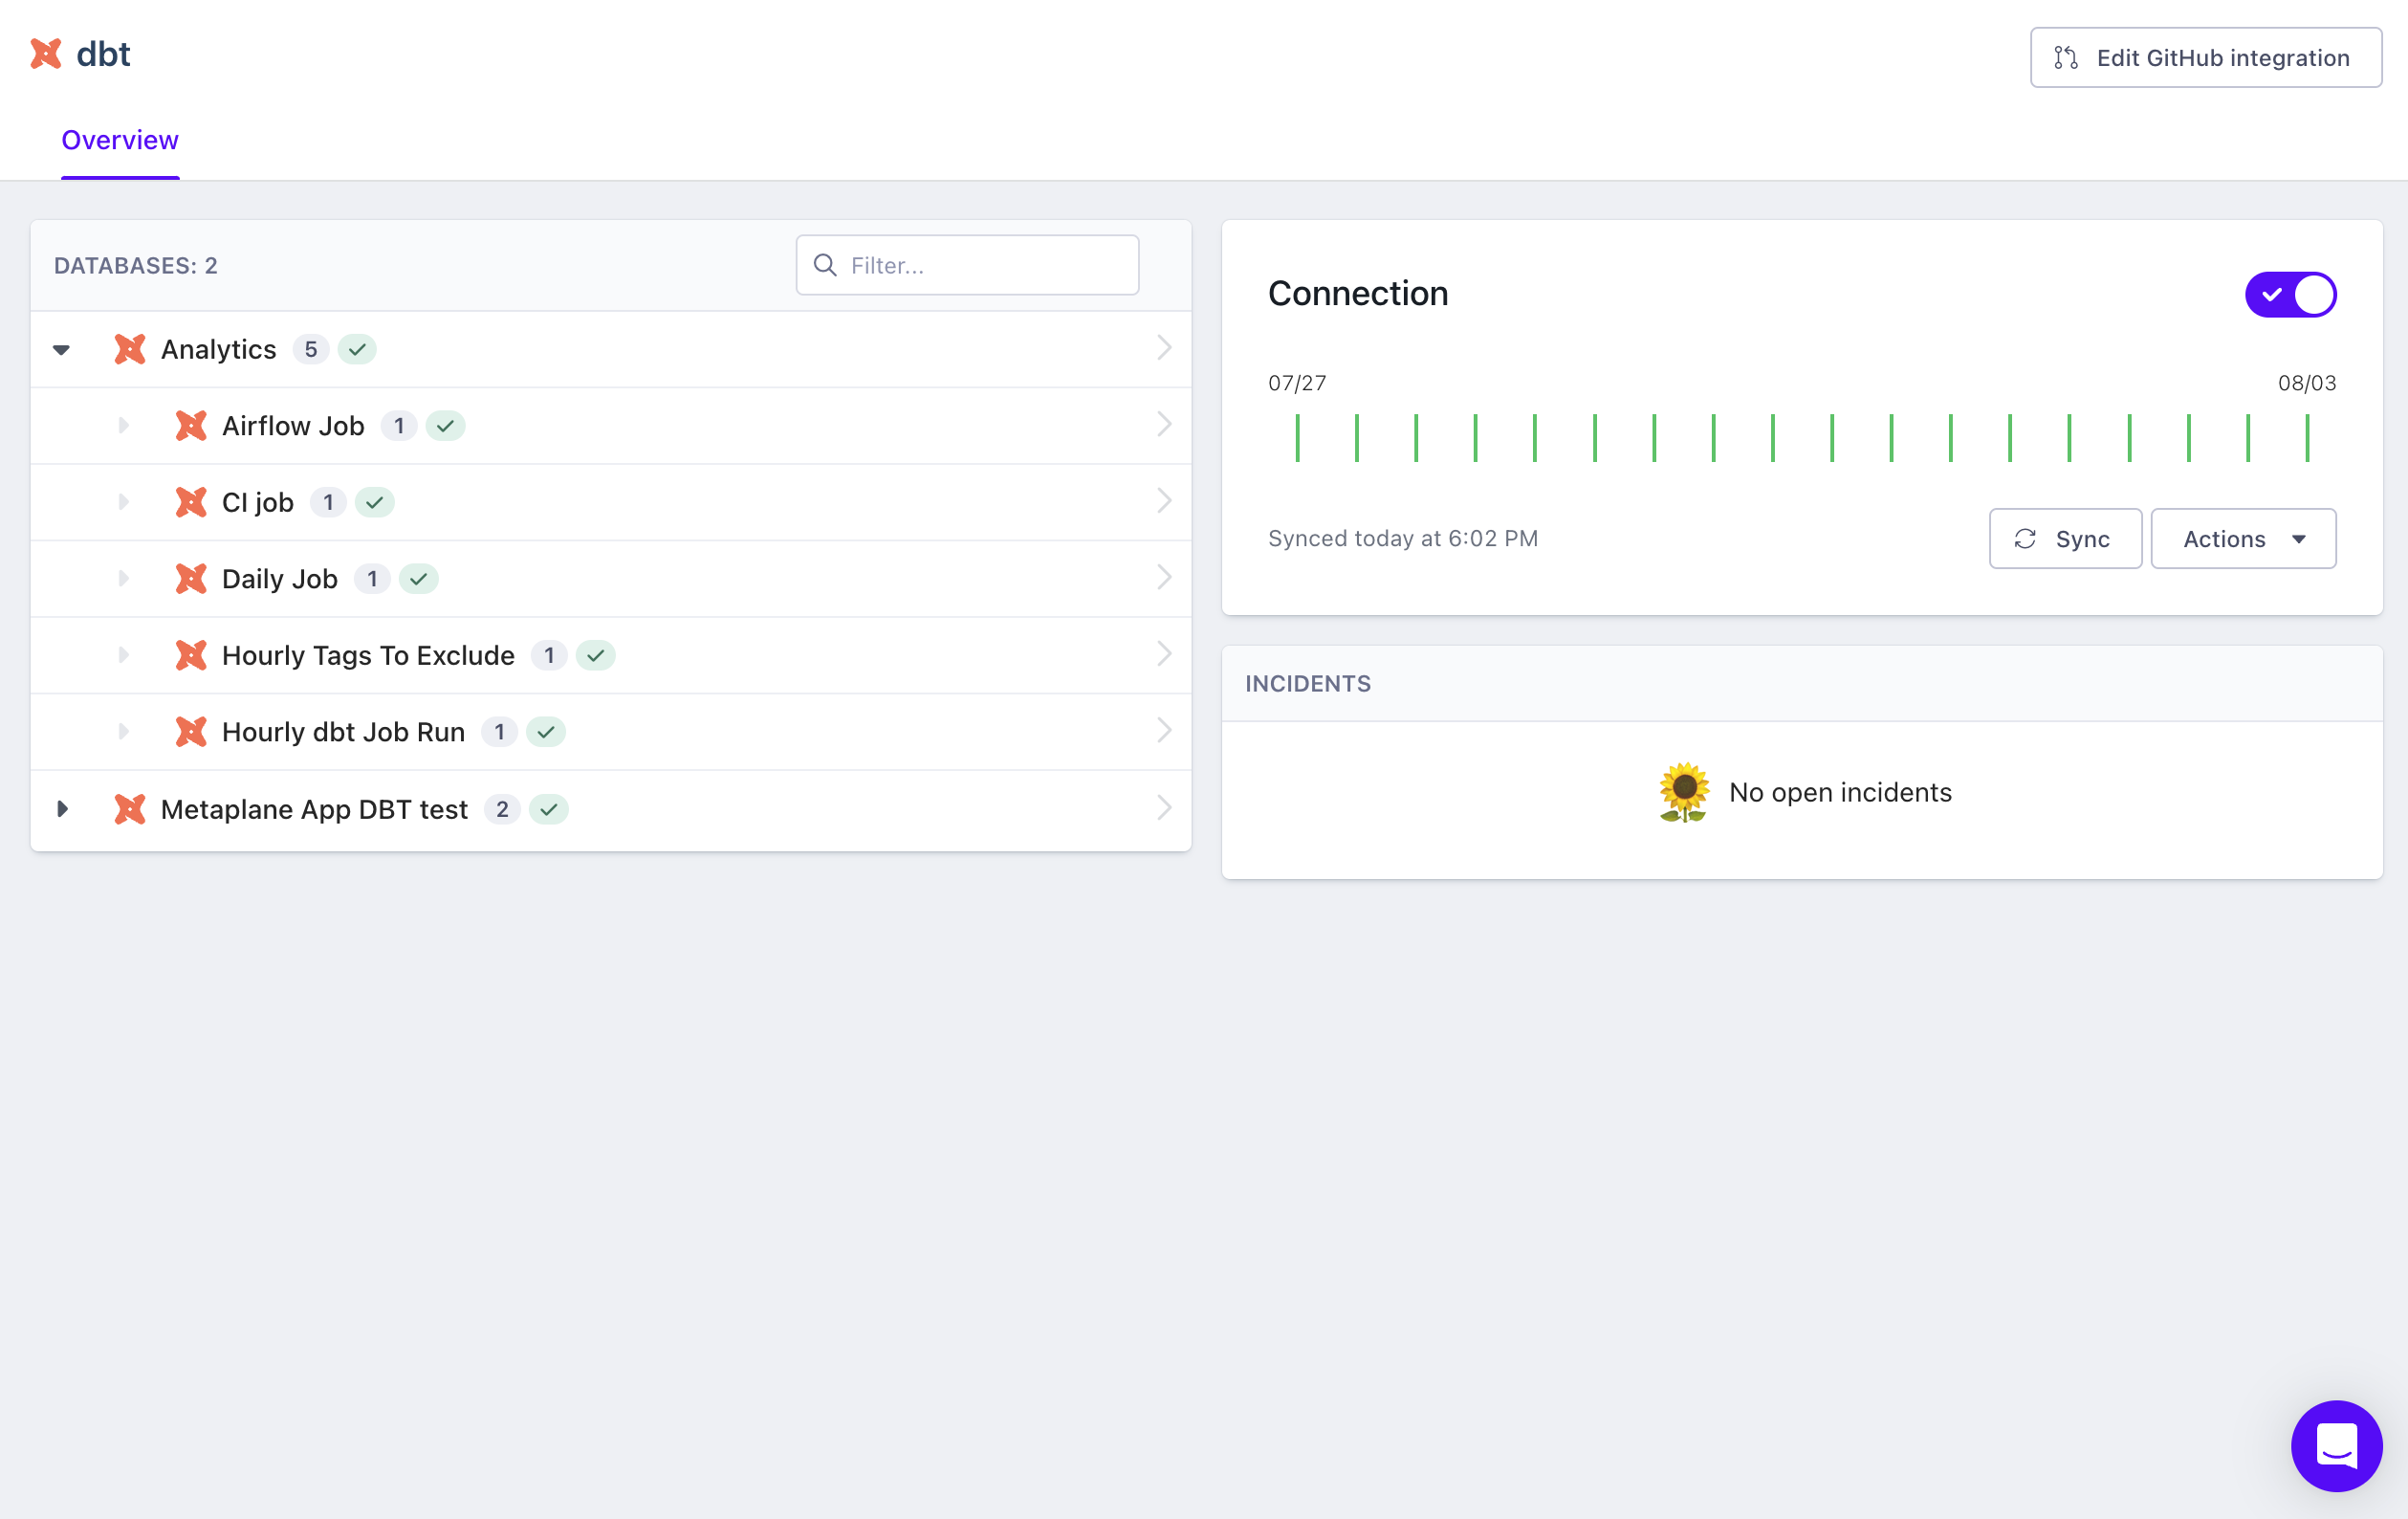
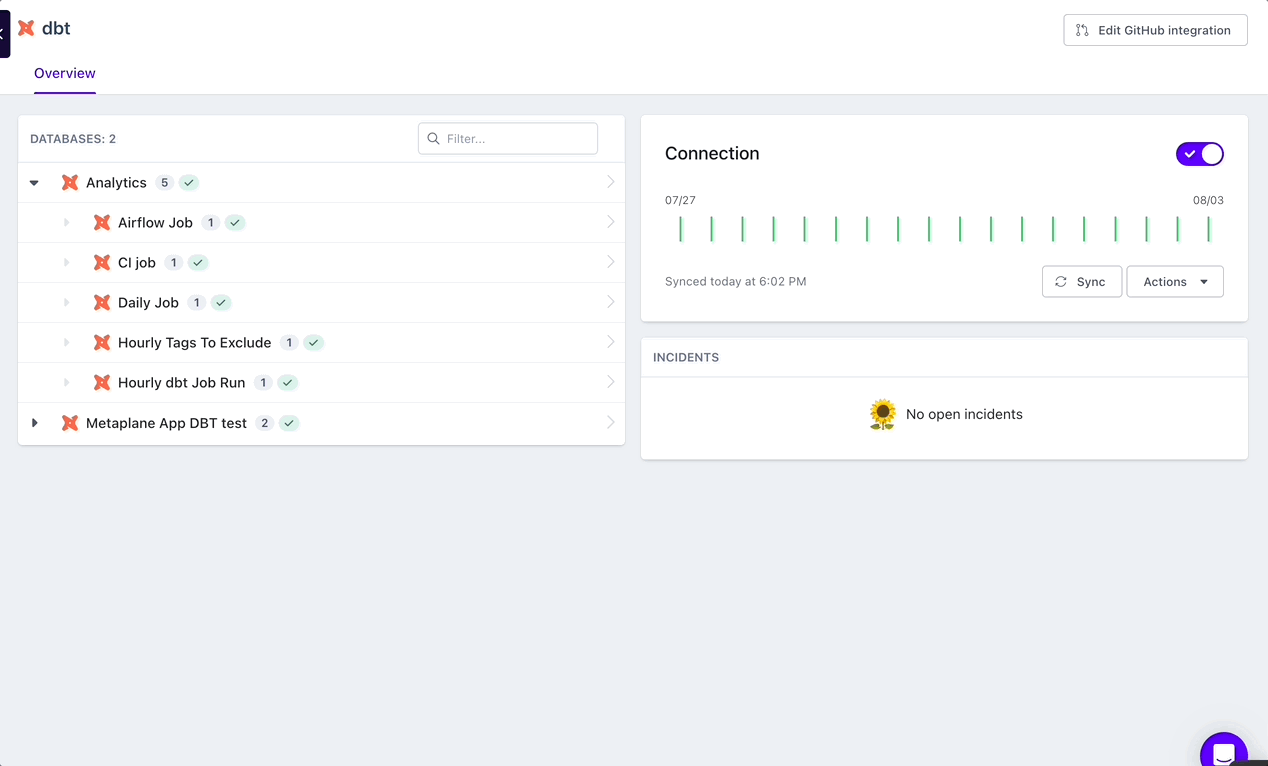
To add a monitor, you'll first need to navigate to your dbt integration page by clicking the dbt icon on the left hand side bar.
- Once you're on the page, you'll be able to see a list of your models, along with associated jobs nested underneath.
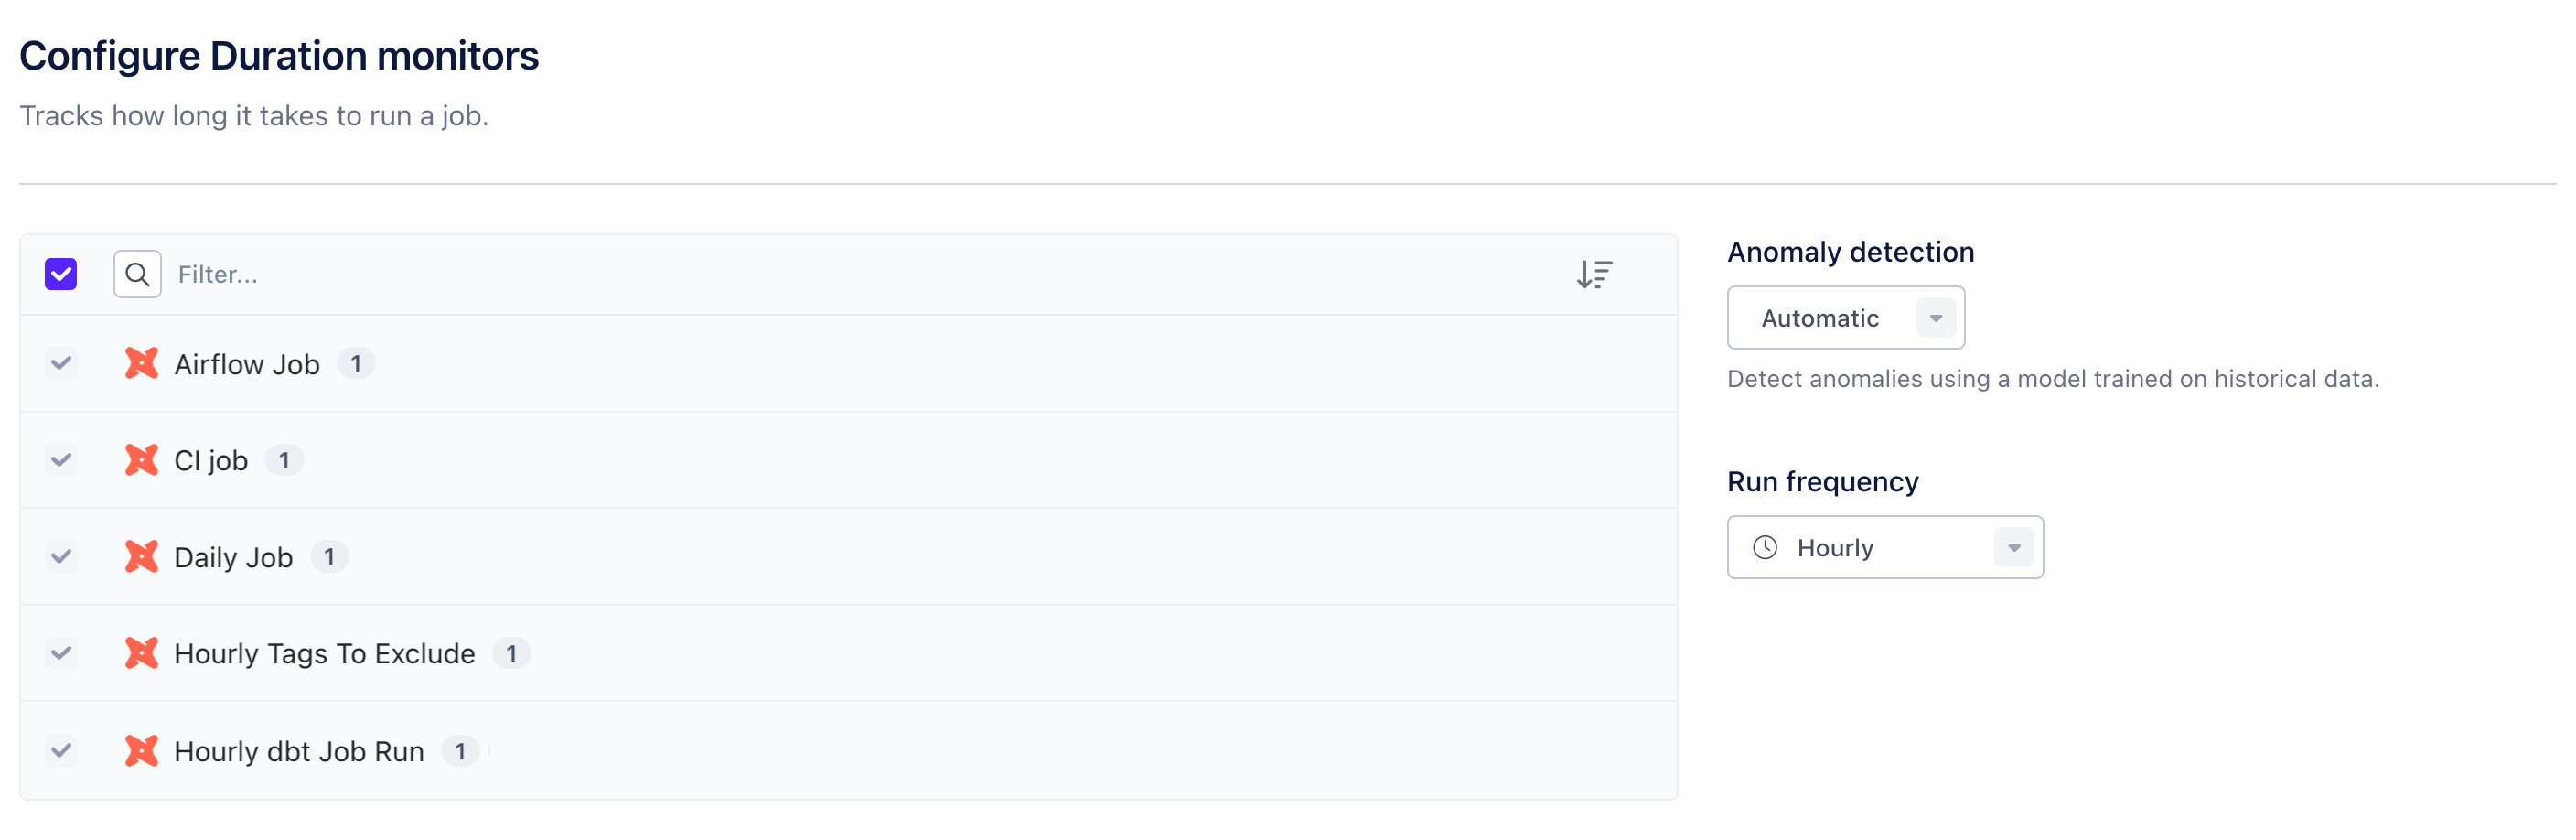
- You can then either click into the primary project or an individual job to add a monitor. After moving to the next page, you'll be able to add a Duration monitor from the top right hand corner.
- You can then select your job(s) to be monitored, along with whether you'd like to set a manual threshold (e.g. for critical time sensitive jobs) and how often you'd like the monitor to check for anomalies. You'll be able to edit these settings at any time in the future as well.
What's next: Metaplane will begin syncing historical job runtime after creating your monitor. If you're using automatic anomaly detection, we'll use this data to train our machine learning models for dbt job duration incidents. Downstream/upstream lineage from dbt will be available within monitors and alerts within 24 hours.
(Optional) Configuring your monitors after creation
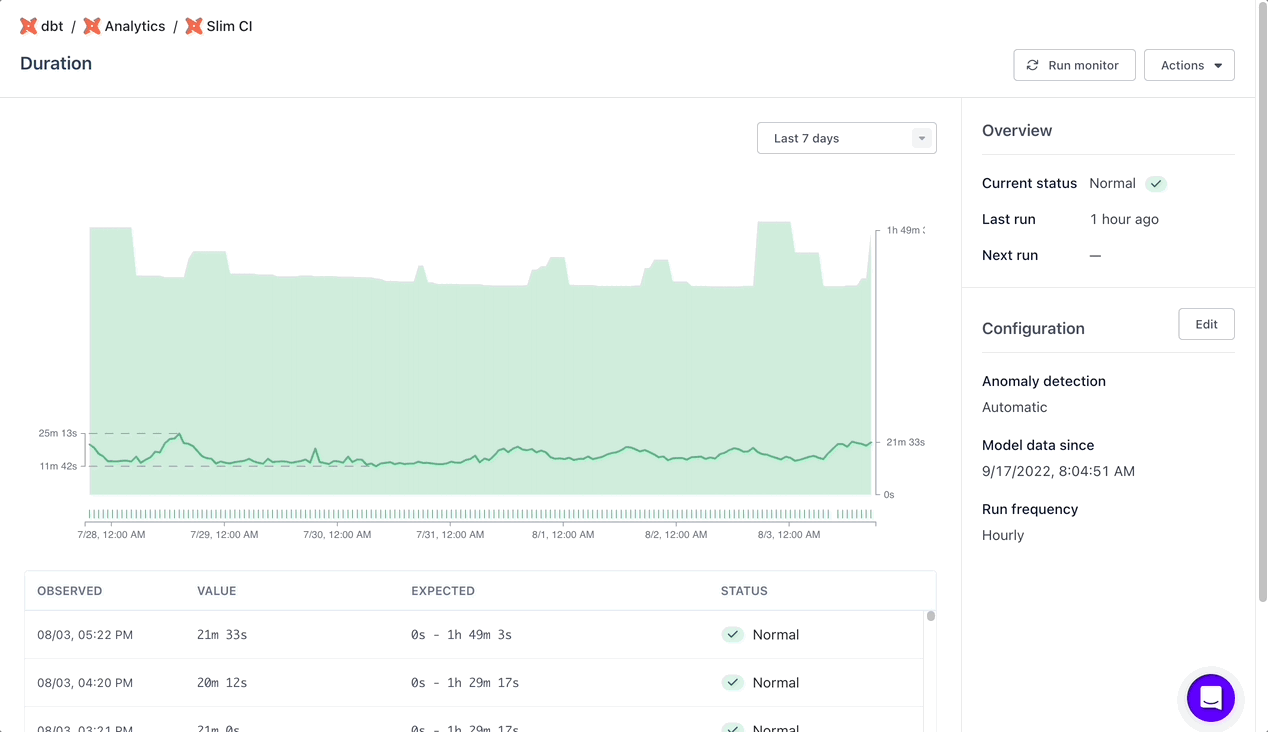
Start on the monitor page that you'd like to configure. From there, you can select a either a manual threshold or select a date window for dbt job duration data used to train our anomaly detection models. Don't forget to click "Save"!
Updated about 1 year ago