

Incidents
Every failing monitor in Metaplane automatically triggers a new incident. Incidents can have a single monitor or multiple monitors associated; when your data stack is suffering from multiple data quality issues, it may be the case that the individual anomalies are actually related. In cases like these, additional insights can be gleaned by examining the related anomalies together in order to gain a higher-level perspective on what’s going on.
Incidents is a feature that automatically groups related failing monitors for you while also presenting you with easy-to-digest, interactive summaries complete with aggregate downstream impact, usage, and more.
There are a couple of benefits to Incidents:
- Viewing groups of failing monitors through the lens of an Incident may provide additional insight that may not be obvious when sifting through individual failing monitors.
- Incidents help combat alert fatigue when multiple data quality issues arise all at once. Instead of getting alerted for every individual failure, Metaplane will alert you about related groups of failing monitors.
Interacting with Incidents
Incidents introduce a slight adjustment in workflow. Previously, users would get an individual alert per failing monitor. Now, alerts may be summaries of multiple failing monitors while giving you the option to navigate into the app for more context.
From the Incident page, users may perform the following actions:
- Label the Incident - If you are investigating an incident, it is often helpful to assign a label so your team knows the current status of the incident.
- Assign an owner - Assign a Metaplane user to be the DRI of an incident.
- Drill in to specific failing monitors - If you need to take a closer look at a monitor's chart or its details, you can click through to the test page from the Incident detail page.
- Mark all or individual monitors as normal - While individual Incident monitors can be marked as normal, you can also choose to mark all of the related tests as normal in a single click.
Incident labels
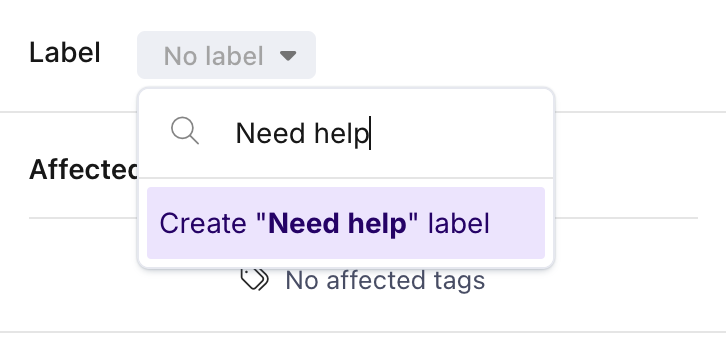
You can create and assign custom labels to communicate with your team.
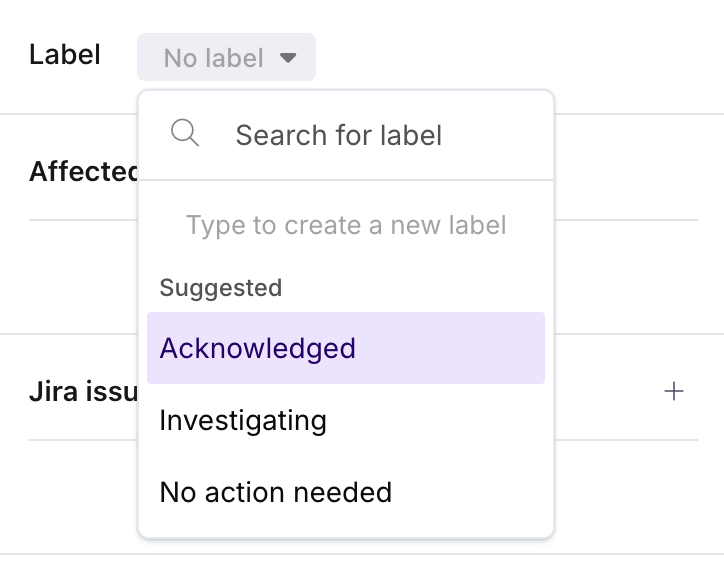
You can either select from one of the Metaplane-suggested labels or simply start typing to create your own.
Incidents can also be assigned (but not created) via Slack alerts.
Incident owners
You may specify an owner for the incident by using the Assigned to input in the side panel.
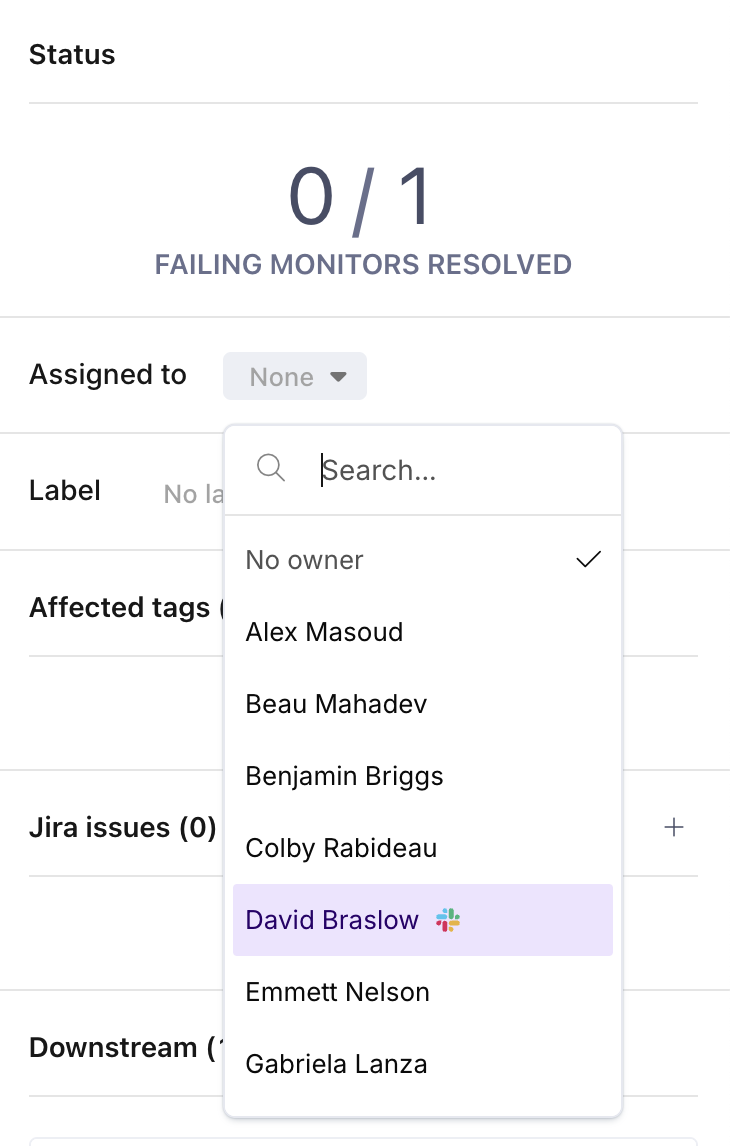
Owner options with icons next to their name signify that the user has an identity mapping to a 3rd party integration, e.g., Slack or MS Teams. This means that incident alerts will @-mention them.
If your org integrates with Slack or MS Teams and you select a user without an identity mapping, you'll see the following dialog.
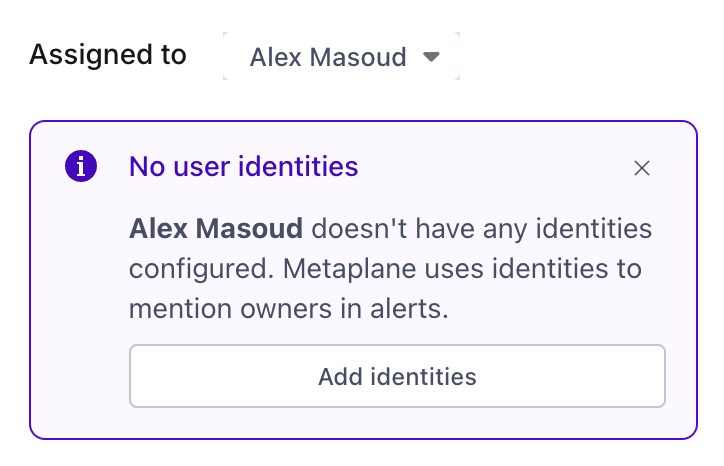
You can then follow the prompt to create a mapping for the selected user. You can also dismiss the dialog if you prefer to not add a mapping.
Owners can also be assigned via Slack alerts.
Incident monitor grouping
As we learn more about your data stack and its interdependencies, Incidents will get better at associating related failures.
Today, Incidents will group failing monitors together if the monitors meet the following conditions:
- The failing monitor types match
- The failing monitors are failing in the same direction, for example the monitors all exceed the expected threshold
- One of the following is true:
- The failing monitor types are associated with the same part of your stack, e.g., failing monitors associated with columns of the same table, or tables that are part of the same schema, etc. For example, if multiple table freshness monitors are failing, Incidents will group them together if the tables are part of the same schema.
- The failing monitors are related by lineage to each other. For example, An upstream table with a failing row count monitor will be grouped with any downstream tables with failing row count monitors.
Incident notifications
Incidents are designed to only send you notifications when there is important information to look at. We will send a notification in the following situations:
Slack (setup instructions)
- We always send the incident alert when a new incident is opened.
- We will send a daily reminder notification for incidents that are still open.
Pagerduty
- We will create a Pagerduty incident when a Metaplane incident is opened.
- We will update the Pagerduty title when new monitors are linked to the Metaplane incident.
- We will resolve the Pagerduty incident once the Metaplane incident has been resolved.
Viewing All Incidents
Aside from viewing specific incidents in your integrated notification tool, such as Slack or Microsoft Teams, you'll also be able to find Incidents through the sidebar.
Note: By default, we'll only show you active incidents. You can display other incident statuses by selecting them in our platform.
Filtering Incidents
In addition to filtering by current incident status, you'll be able to filter the incidents displayed by Sources (e.g. Snowflake, dbt) and Tags.
Incident settings
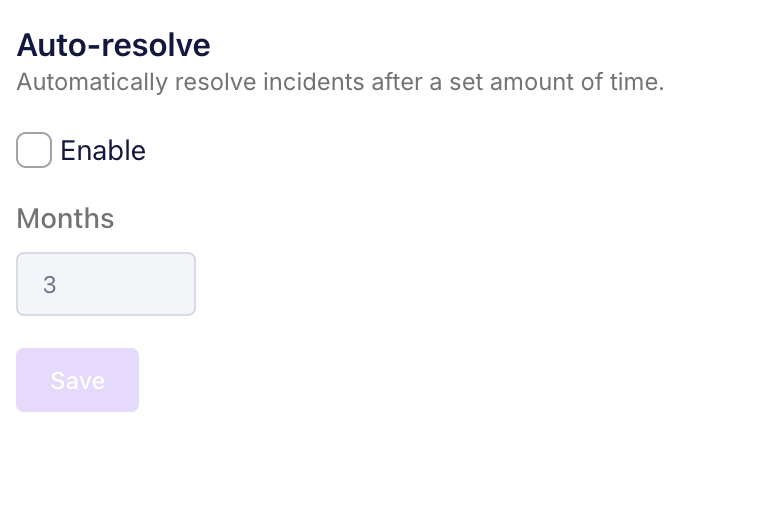
Auto-resolve
In the Settings page, under the Incidents tab, there is a setting for Auto-resolve that controls how long an incident monitor can be open before Metaplane will automatically resolve it and reset the monitor. Sometimes, an incident can inadvertently get ignored or missed, causing the incident to stay open for a long time without user intervention. This can be problematic because it can hide any future incidents since a failing monitor will not re-alert until it has resolved and alerted again. A long list of long-running incidents can also cause alert fatigue, and make it harder to feel like you have your incidents under control. This setting can help to keep your incident list clean and manageable.
Caveat: the following two types incidents will be excluded from this setting:
- If the incident has been labeled, we will not auto-resolve.
- If the monitors in the incident are freshness monitors, we will not auto-resolve.
Updated about 1 year ago