

Group By monitors
Monitor logical groups within tables/views so you can detect subtle quality issues and quickly diagnosis root cause
Monitors are great for detecting data quality issues across your tables and columns. However, monitors that operate on a whole table may miss subtle quality issues within a segment of your data.
For example, while the row count of your events table appears to be within a normal range, the row count for one or more specific event types could be below what’s expected — these subtle deviations may be small enough that they don’t affect the aggregate row count and therefore don’t cause the monitor to alert. This type of issue can occur with other types of monitors as well, e.g., freshness, distribution, nullness, etc.
Group By monitors allow data teams to define the logical segments (for example, aggregating by values in a dimension column) that make up a table and then apply monitors to those segments. This means that data teams can monitor, say, the aggregate row count of a table as well as the row count for the logical groups within that table.
Getting started
In order to configure Group By monitors you’ll first need to navigate to the table that you want to target. You can do this by either searching for the table or navigating to a Connection and then drilling down to the table.
Once you’ve navigated to the table, you'll be able to create Group By monitors through the pane on the right hand side.
The creation of Group By monitors involves 2 steps:
- Defining the logical groups that make up the table
- Configuring the monitors that you want applied to the groups
Defining logical groups
Before Metaplane can add monitors to your table segments, we first need to understand how to isolate the dimensions that your team cares about.
After clicking “Define groups” you’ll have the option to select one or several of the columns to group your monitors by. Once you select column(s), we'll provide a preview of the values within the column, as well as how many groups your table consists of.
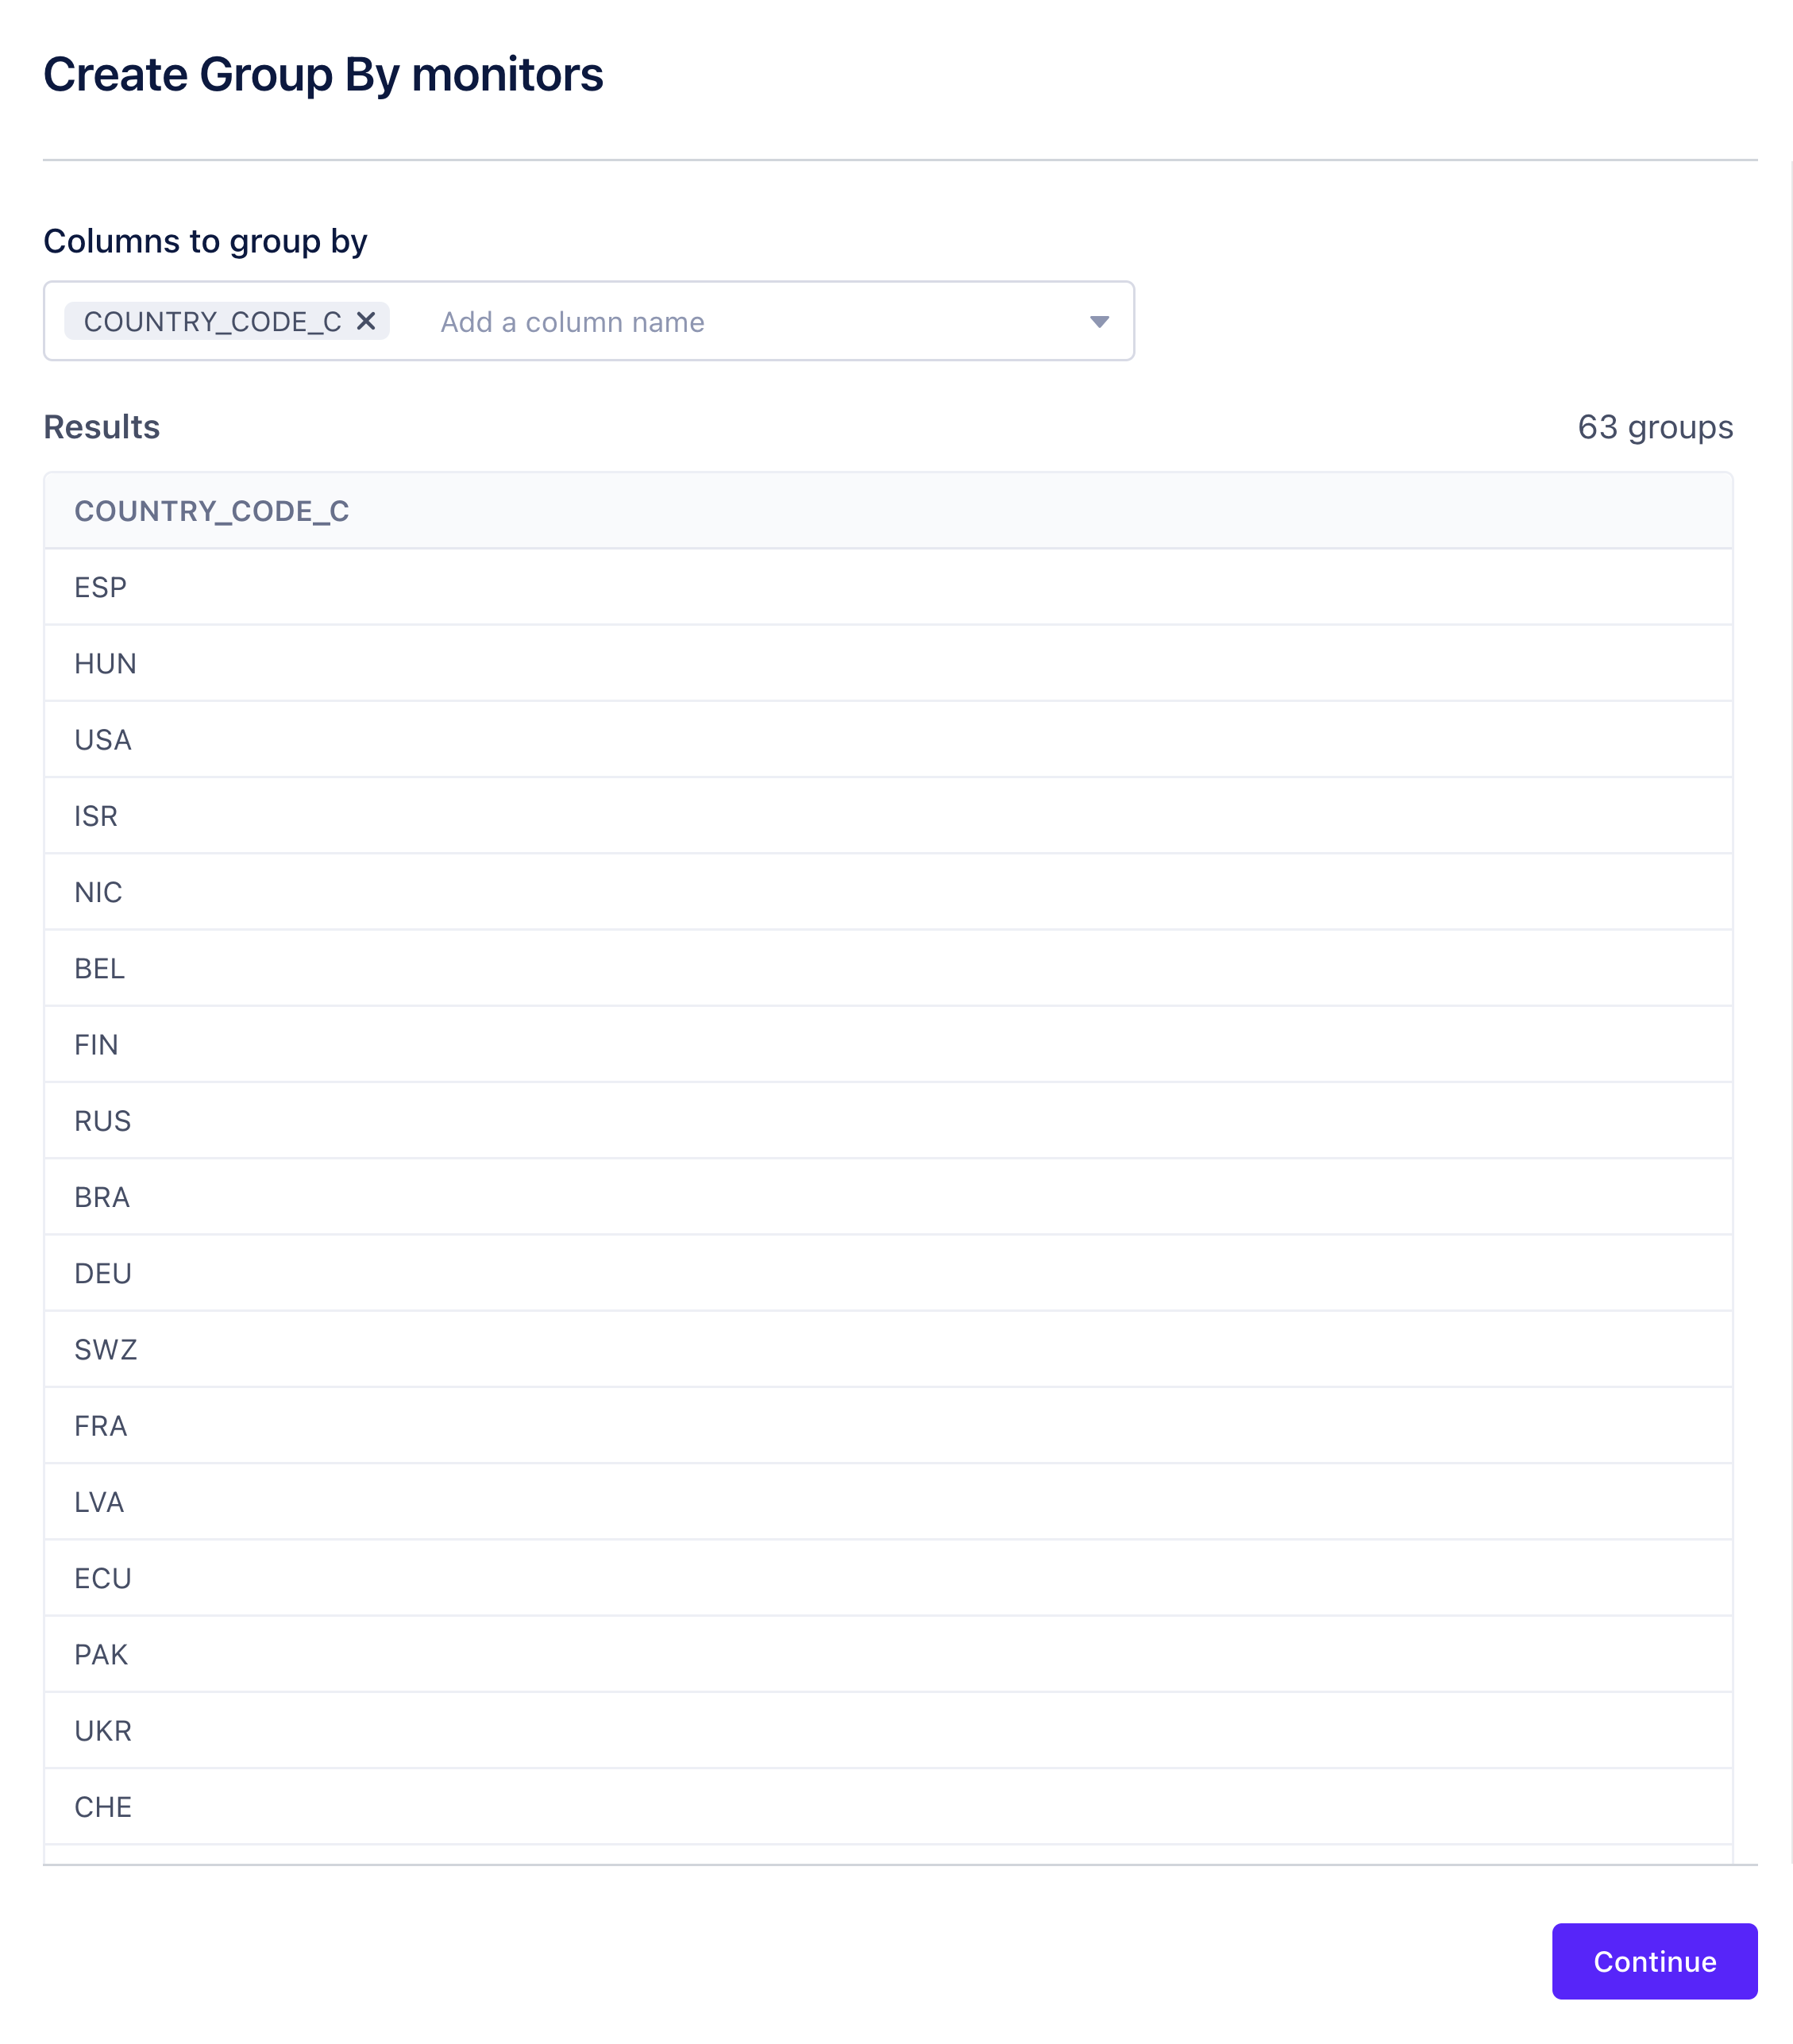
By default, Metaplane will treat the set of groups as a ***dynamic*** set. That is, as new column values are introduced over time, Metaplane will automatically apply monitors to the respective groups.
Next step
Once you’ve defined how to isolate your table’s groups, you can now configure the set of monitors that you want applied to those groups.
Configuring monitors for your logical groups
At this point Metaplane now understands the set of groups that are important to your organization. Now, you’ll need to configure how you’d like to monitor those groups.
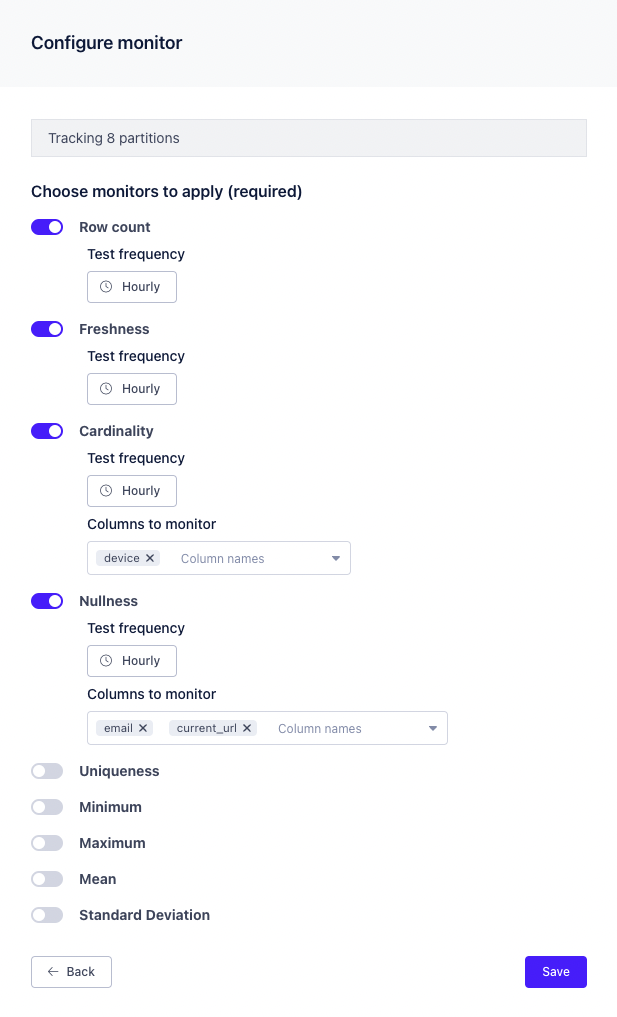
The monitors that you configure will get applied to the logical groups that you defined the previous step. When/If new values in your groups are introduced over time then these same monitors will get applied to those as well. Similarly, Metaplane will automatically disable monitors for groups that stop being included in the active set of groups.
Click “Save.”
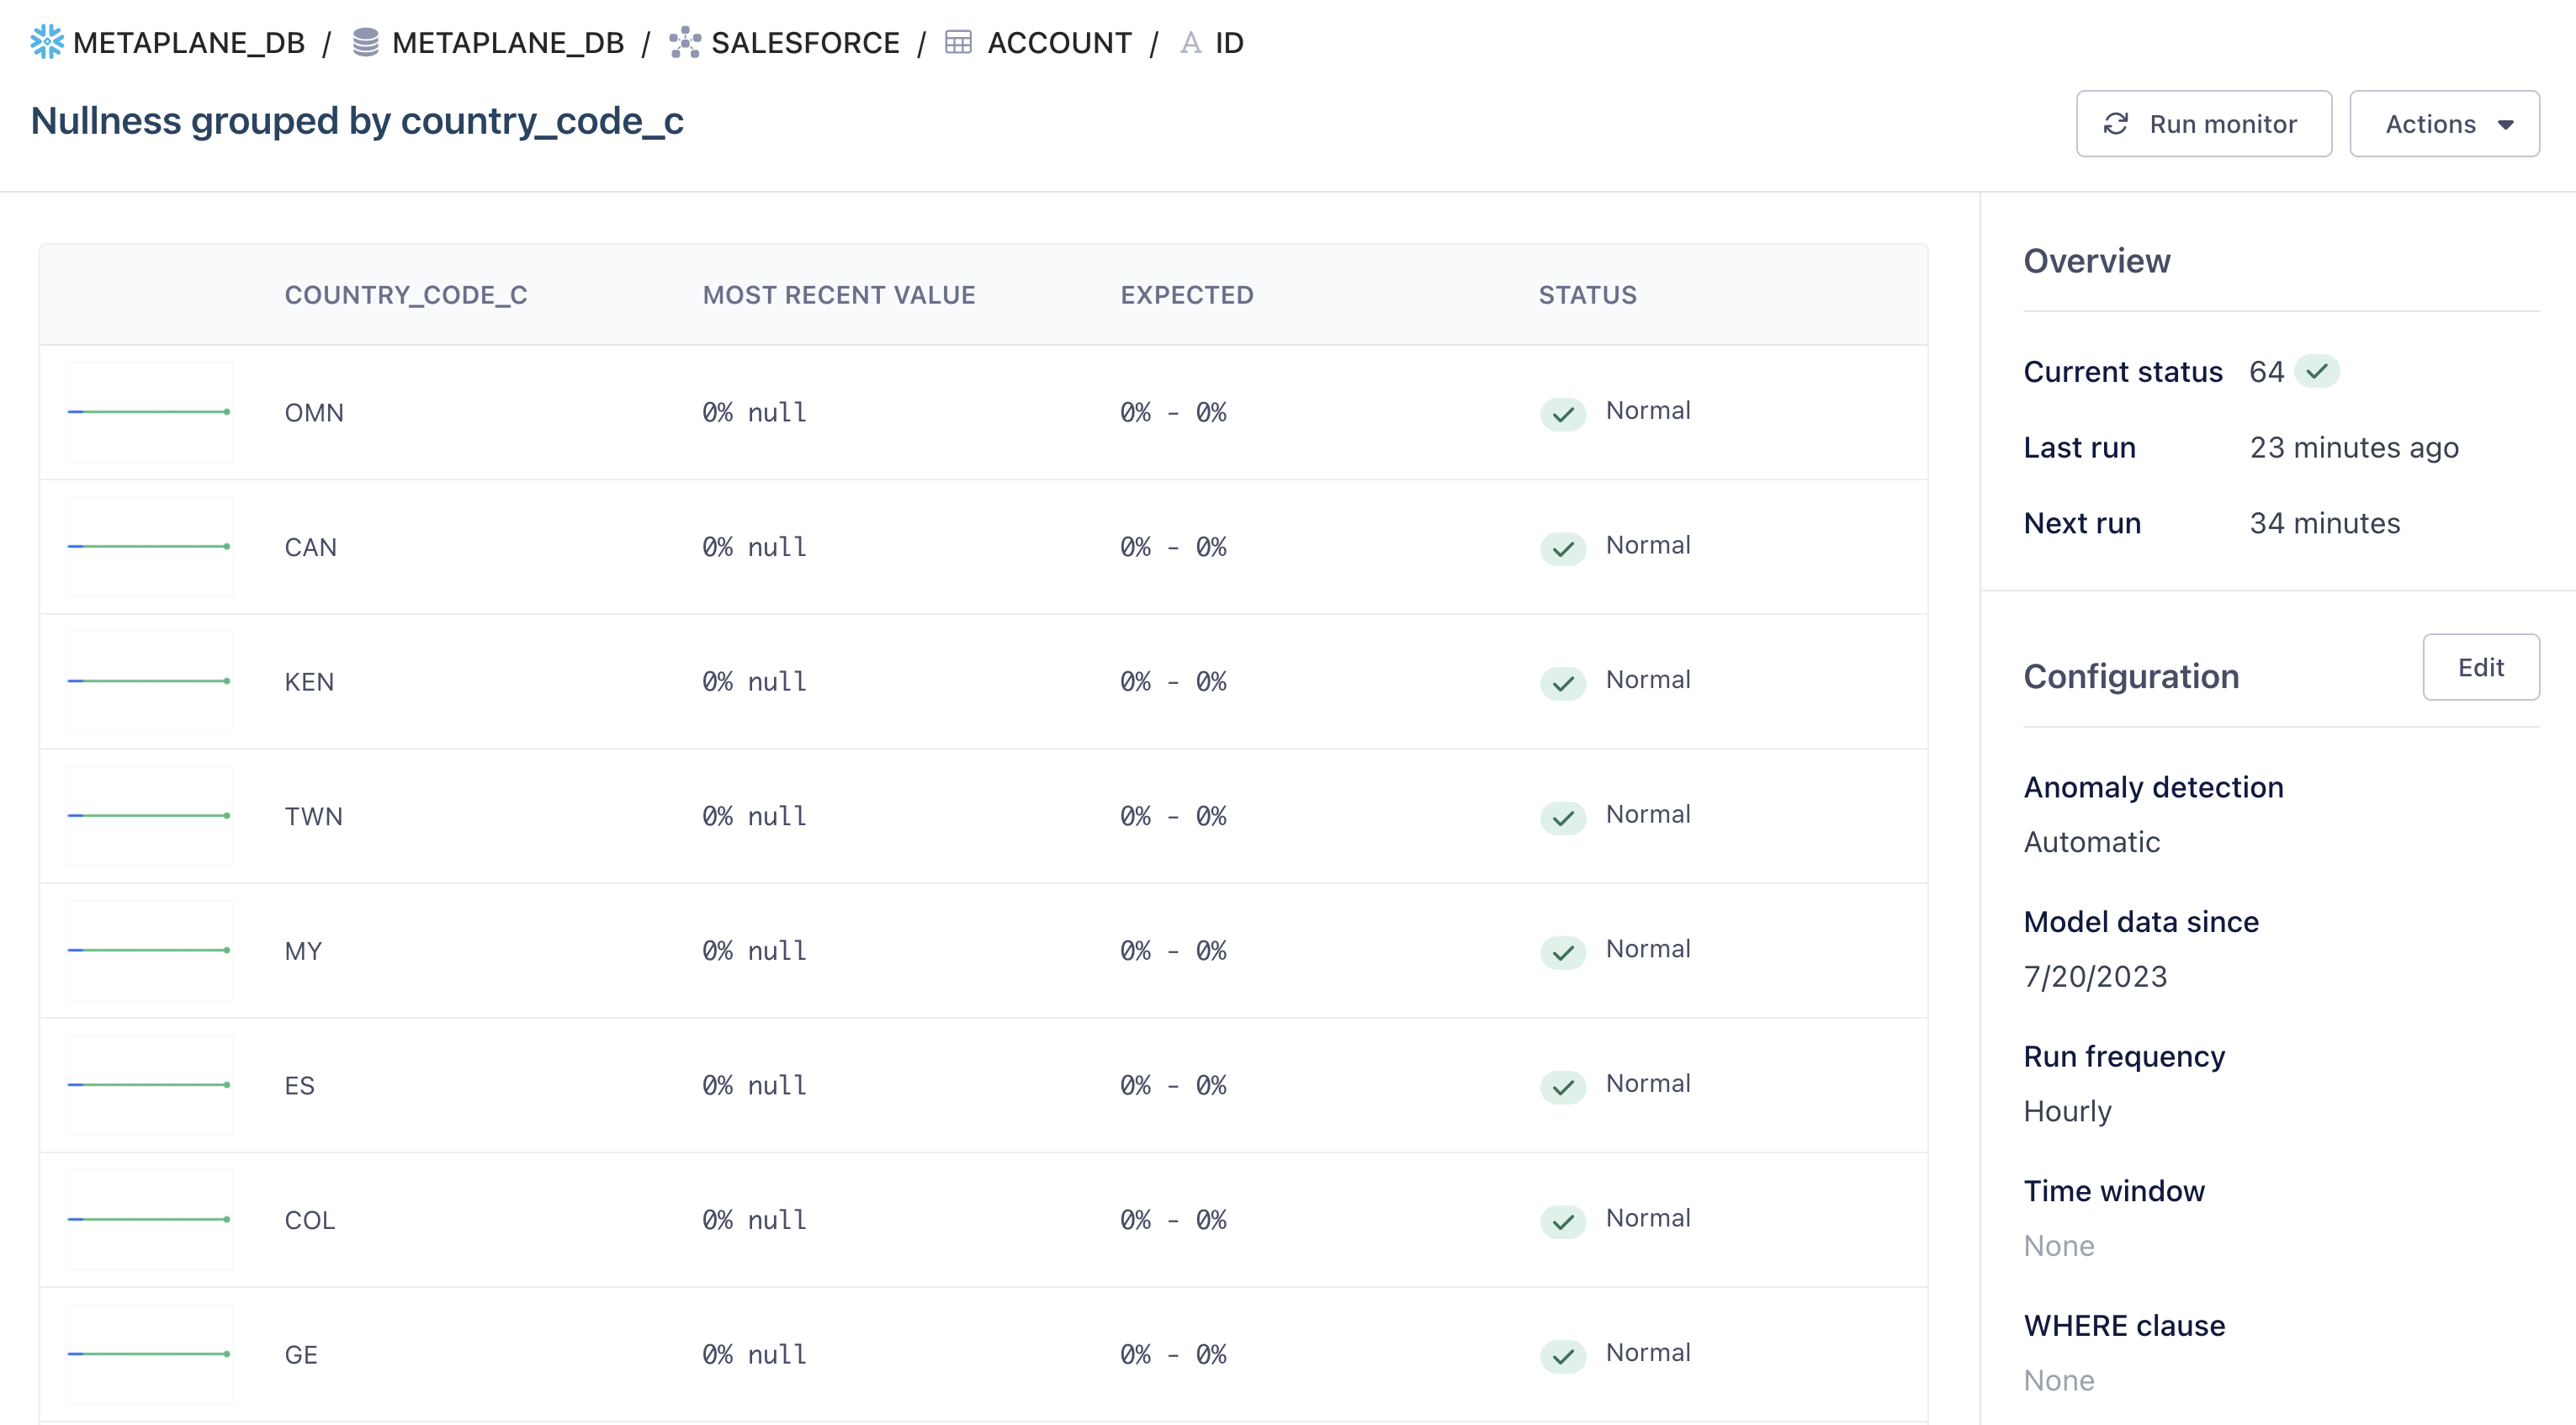
Once you’ve saved the Group By monitor configuration, the monitor card on the table page will populate with both the groups and monitors that you’ve configured. You can configure your monitor(s) after creation - through the options on the bottom right hand corner.
Incident alerts related to specific groups will be explicit about the affected group(s).
Custom SQL
When you use a "GROUP BY" statement as part of your query in a Custom SQL monitor setup, we'll display the output of your queries in those logical groups that you've defined.
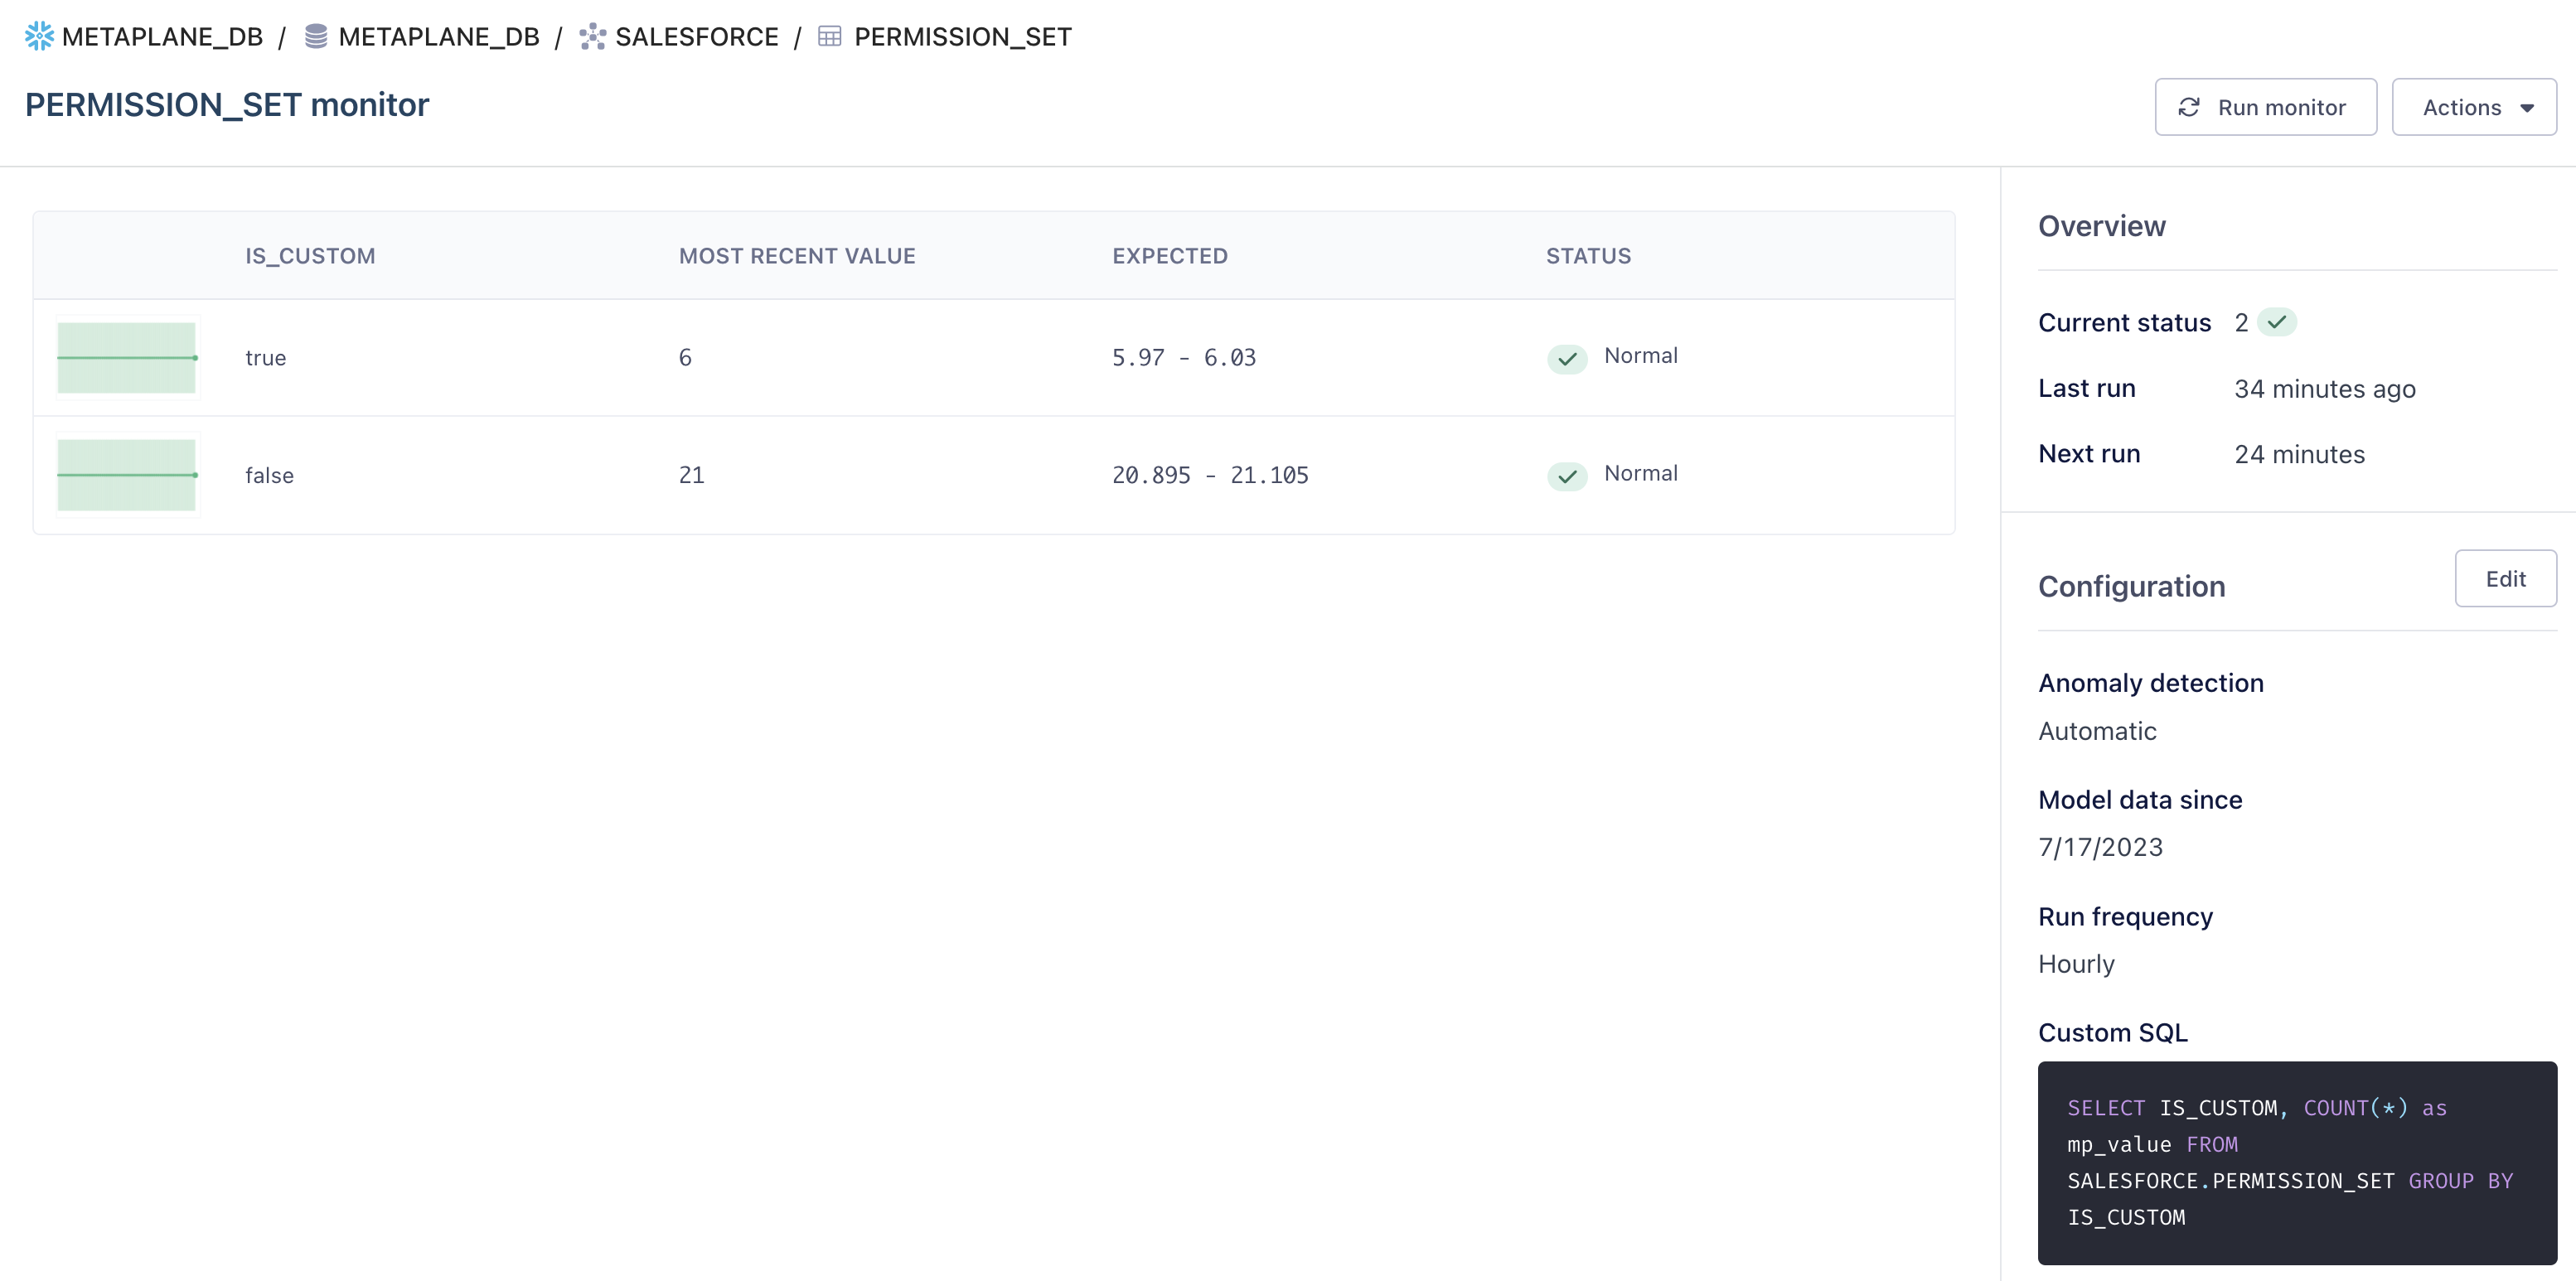
In the example above, the organization wants to understand the count of custom permission sets to ensure that the revenue operations team has an overview of how many sets they can feasibly manage. By entering the SQL statement above, Metaplane created the logical groups (i.e. "true", "false") and calculated an acceptable threshold using the current values within the PERMISSION_SET table. If more values (e.g. "unknown_true_or_false") are added, new logical groups and monitors will be added above. Similarly, as values of logical groups are deprecated (e.g. "true"), monitors will also be disabled.
Use cases
There are use cases where Group By monitors are a great fit for your monitoring needs and other cases where Group By monitors are a bad fit.
Good fit
Generally, Group By monitors are great when the set of logical groups that you care about are relatively stable over time. For example, logically grouping by marketing channel, by event id, or some other column(s) with a relatively small and stable cardinality. Groups that stay relevant for longer periods of time will give our model time to train and alert with confidence.
Bad fit
Generally, creating logical groups using date-based columns won’t often work the way that you’d expect. It’s fine to use date-based columns in custom SQL to constrain the returned column values, but in most cases you won’t want to group your table by those columns for a couple of reasons:
- It takes our model roughly 3 days to train and every group/monitor type combination gets its own monitor. Therefore, if you’re grouping by, say, a day-granularity timestamp (like midnight), then it’ll be at least 3 days before you’ll get alerted to an anomaly for a Group By monitor created today. Depending on your specific use case, that may be 3 days too late.
- Depending on the granularity of the date-based column, you might end up with more groups than actually matter to you.
That said, there are some exceptions. For example, if a Group by a date-based column is relevant for monitoring for an extended period of time, say at least 2 weeks, it could be reasonable to create that configuration. The longer the Group is relevant past 3 days, the more useful it’ll be to monitor it.
We’ve found that often times, what users actually want is for a monitor to operate on a rolling, date-column-based, window. For example, row count by the last 7 days. Fortunately, that’s a common use case to configure through other means.
We’re always happy to help guide our users on how to best monitor their data stack. If you have a specific use case that you’re unsure how to monitor, please reach out.
Limits
Group By monitors have a limit on how many groups can be monitored. Our Free Forever and Pro plans support 10 groups per Group By monitor. Our Enterprise plan supports 100 groups per Group By monitor. Please reach out if you would like access to more groups.
How to reduce the number of groups in your Group By monitor
If you are hitting the limit on the number of groups in your Group By monitors, you can manage the number of groups in the following ways:
- For standard monitors, you can add a
WHEREclause in the monitor configuration to filter the data being monitored to only the groups that you care most about. - For custom SQL monitors, you can modify your query by adding a
WHEREclause and aLIMITto ensure the number of groups you are returning stays within the limit. - For Snowflake Spend monitors, you can use the built-in warehouse and user filters to limit the groups that are monitored.
Updated about 1 year ago