

End-to-End Lineage
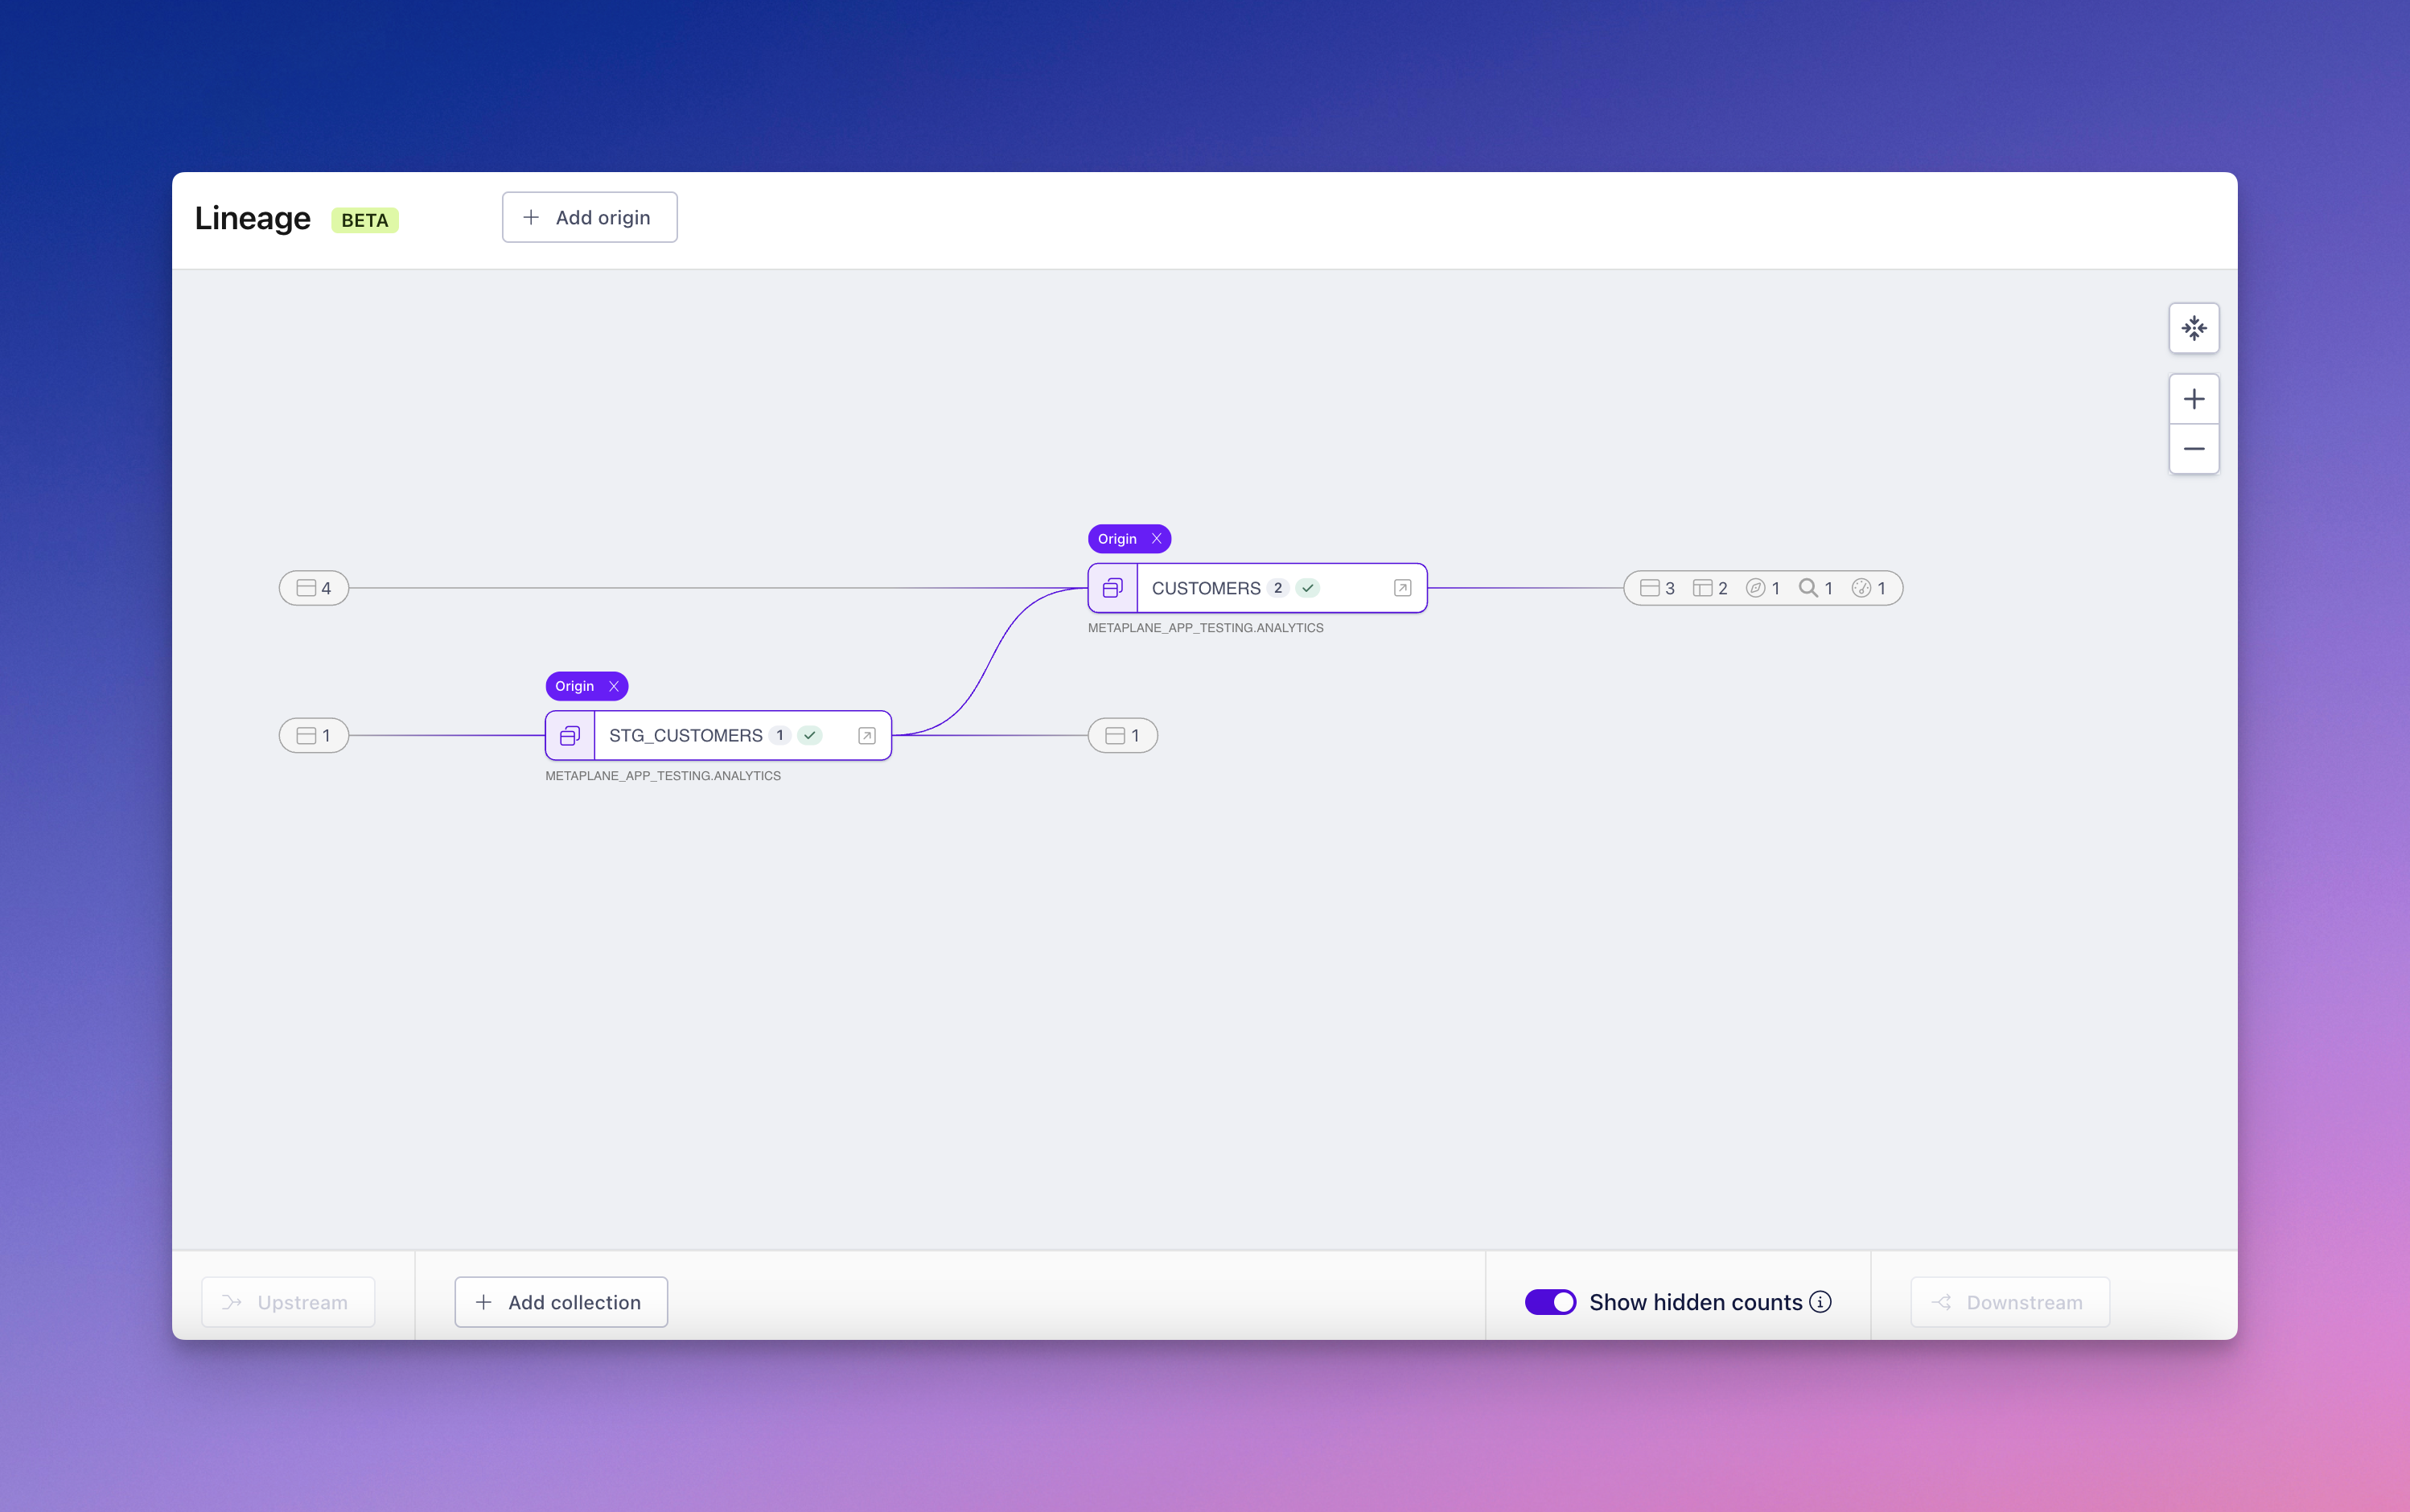
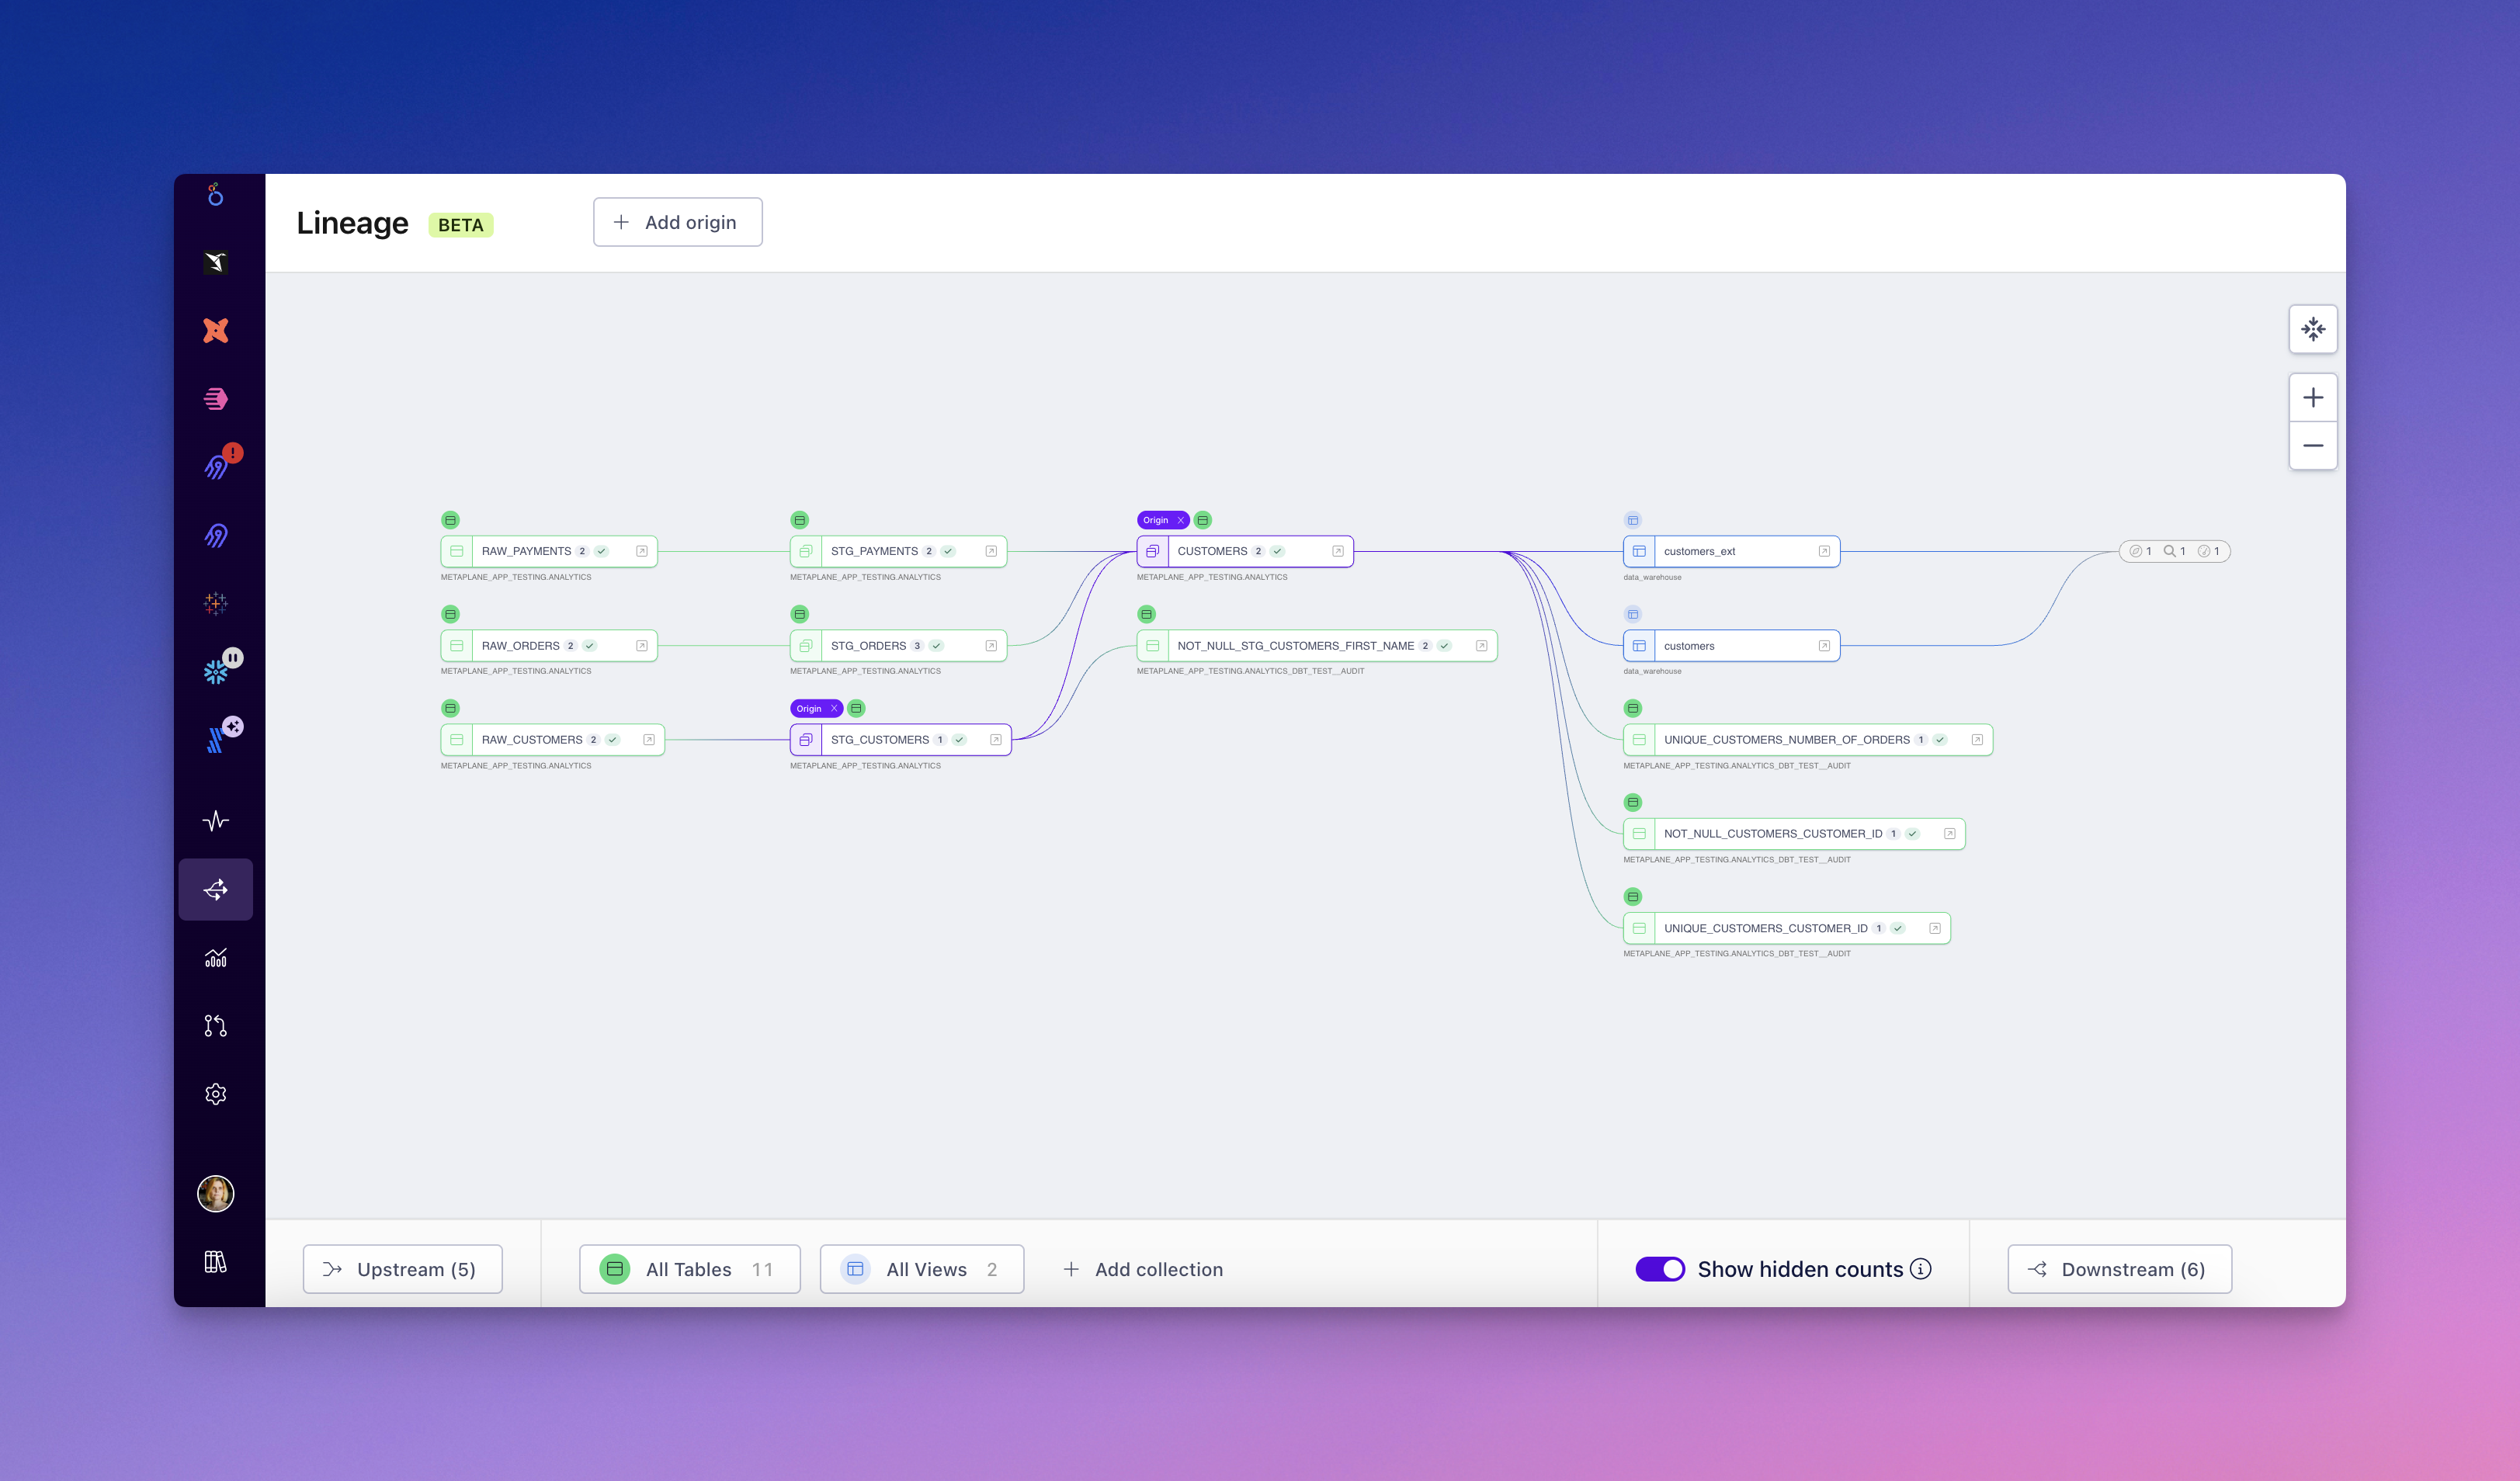
Metaplane automatically uses a combination of parsing queries from your warehouse and metadata available from 3rd party APIs of tools that you've connected in your account to generate a lineage diagram, similar to the one shown below. You're able to define the number of levels either upstream or downstream and which column you'd like to drill into through the dropdowns on the bottom left corner of your lineage graph view.

How Warehouse Lineage is Generated
Metaplane is able to provide intra warehouse lineage, e.g. table → table and column → column connections, via two mechanisms. You can have any combination of these mechanisms enabled
- Metaplane can automatically ingest lineage table level lineage when dbt core or cloud is connected.
- When Metaplane has been given access to your warehouse query logs, we can parse SQL statements to build a column level lineage.
Column Level Lineage (CLL)
To build CLL, Metaplane parses your query history looking for any table or view CREATE statements.Metaplane can parse complex sql statements to figure out what columns are related to one another.
Let’s take a look at a simple query to understand how CLL works in practice:
create or replace view db.schema.customers as
SELECT
  (
    SELECT
      count(distinct owner_id)
    from
      db.schema.deals
  ) as total_deals,
  deal_flow.deal_id
FROM
  deal_flow
WHERE
  deal_flow.amount > 100
In this example, we are creating a new view called customers that has the columns total_deals, deal_id . Our parser looks at each top level column and recursively determines what columns contribute data. Here, we can see that the total_deals column is derived from the deals.owner_id column and the deal_id column is derived from the column with the same name in the deal_flow table. We think of these as “DIRECT” lineage, since the columns are directly contributing their own data to the top level column. Metaplane is also able to parse out “FILTER” lineage, which we think of as any column that isn’t contributing data, but is being used to filter down a result. In the example above, we can see that deal_flow.amount will be picked up as a “FILTER” column for deal_id . By default, our application only shows “DIRECT” lineage.
Stale lineageBecause we parse queries to determine lineage, there are cases where warehouse to warehouse lineage for columns can become stale over time. If 21 days pass with no update to the lineage, we will remove it the next time we see new lineage information for that column come in.
BI and Ingestion Tools
If you've connected any of the business intelligence tools to your Metaplane account, we'll automatically add the dashboards (or equivalent terminology) and relations to objects in your warehouse to your lineage graph, typically found downstream (right hand side of graph).
If you've connected Fivetran to your Metaplane account, you'll be able to see which connectors load data into which tables in your warehouse, located upstream (left hand side of graph).
Where to find Lineage
You have two options to see lineage generated for your data stack.
-
Use the Lineage indicator on the left hand sidebar: This will bring you to the main lineage page. Click the "Add Origin" button to search / browse all of the integrated data warehouses, databases, and data lakes that you have integrated with Metaplane.
-
Use the Lineage tab along the top of your integrated warehouse(s): Find the table(s) and/or column(s) that you'd like to see lineage for, from the entity list page, and use the tab along the top.
How to navigate the Lineage page
There is a difference between in functionality / navigation in the main Lineage page and the Lineage tab associated with an integrated warehouse.
Main Lineage page
Adding Origins
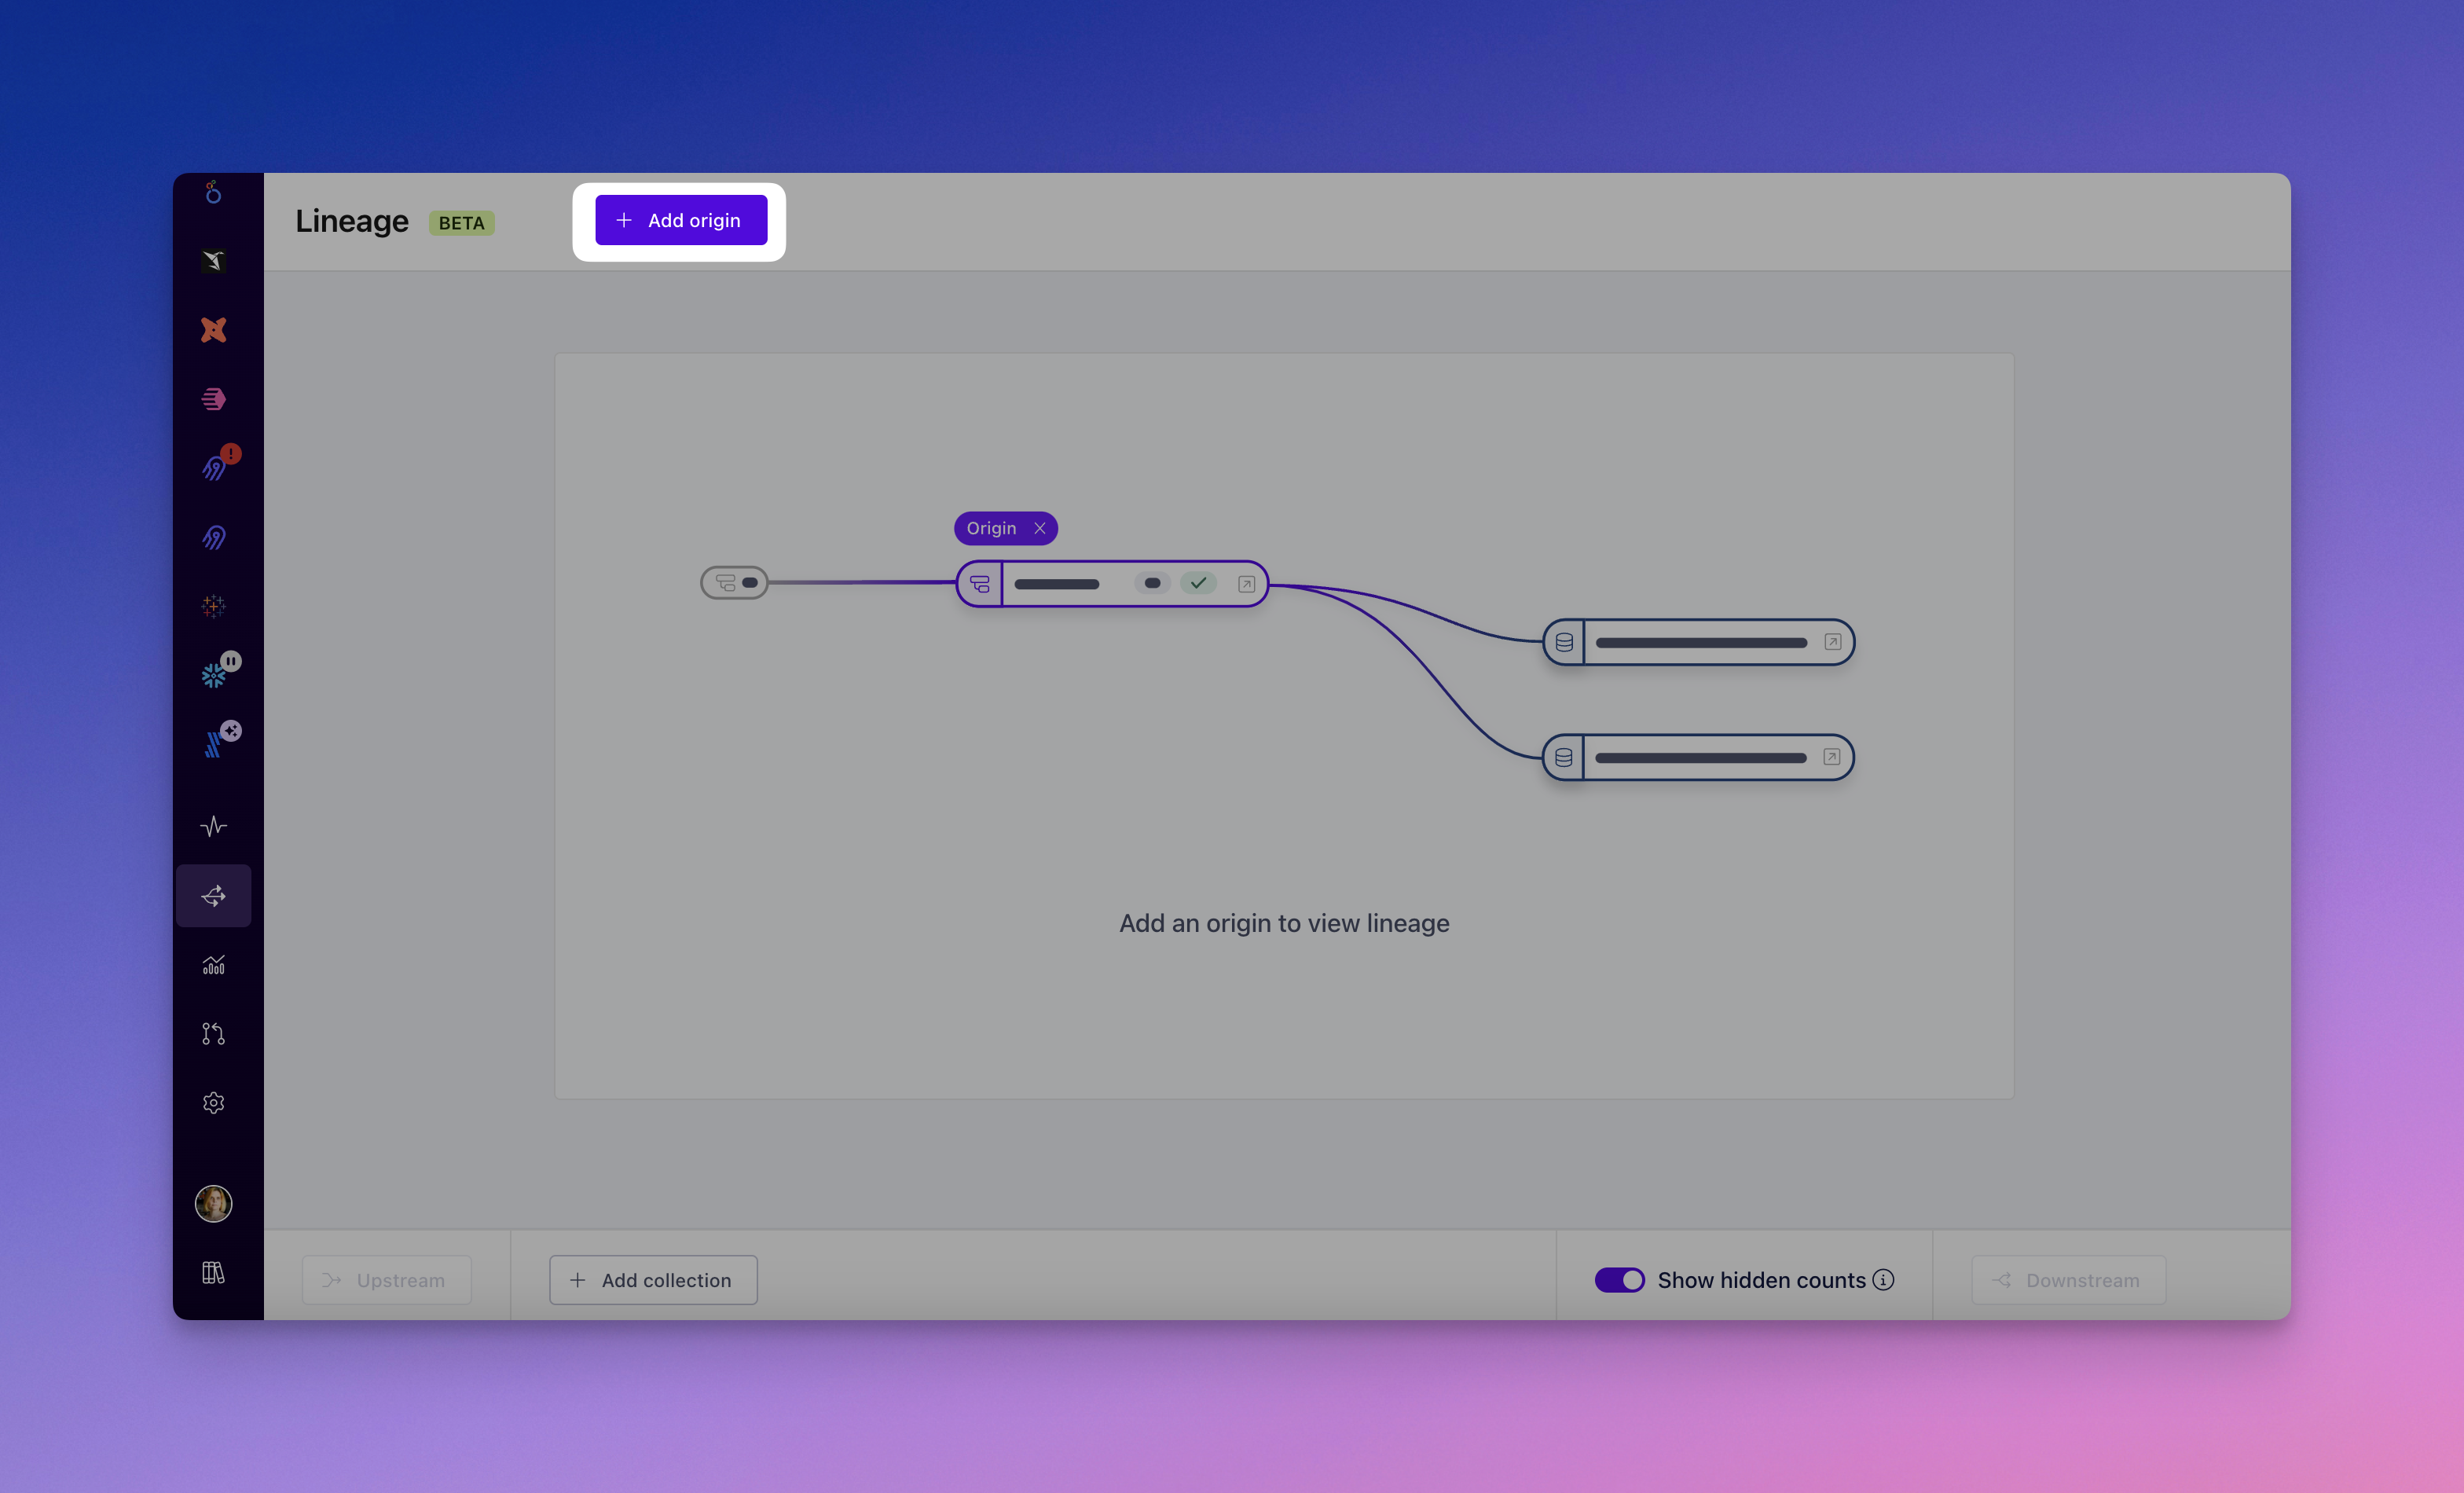
To visualize a particular lineage, start by adding an origin using the "Add Origin" button at the top of the page. You can add as many origins as you like, viewing the lineage for multiple assets at once.
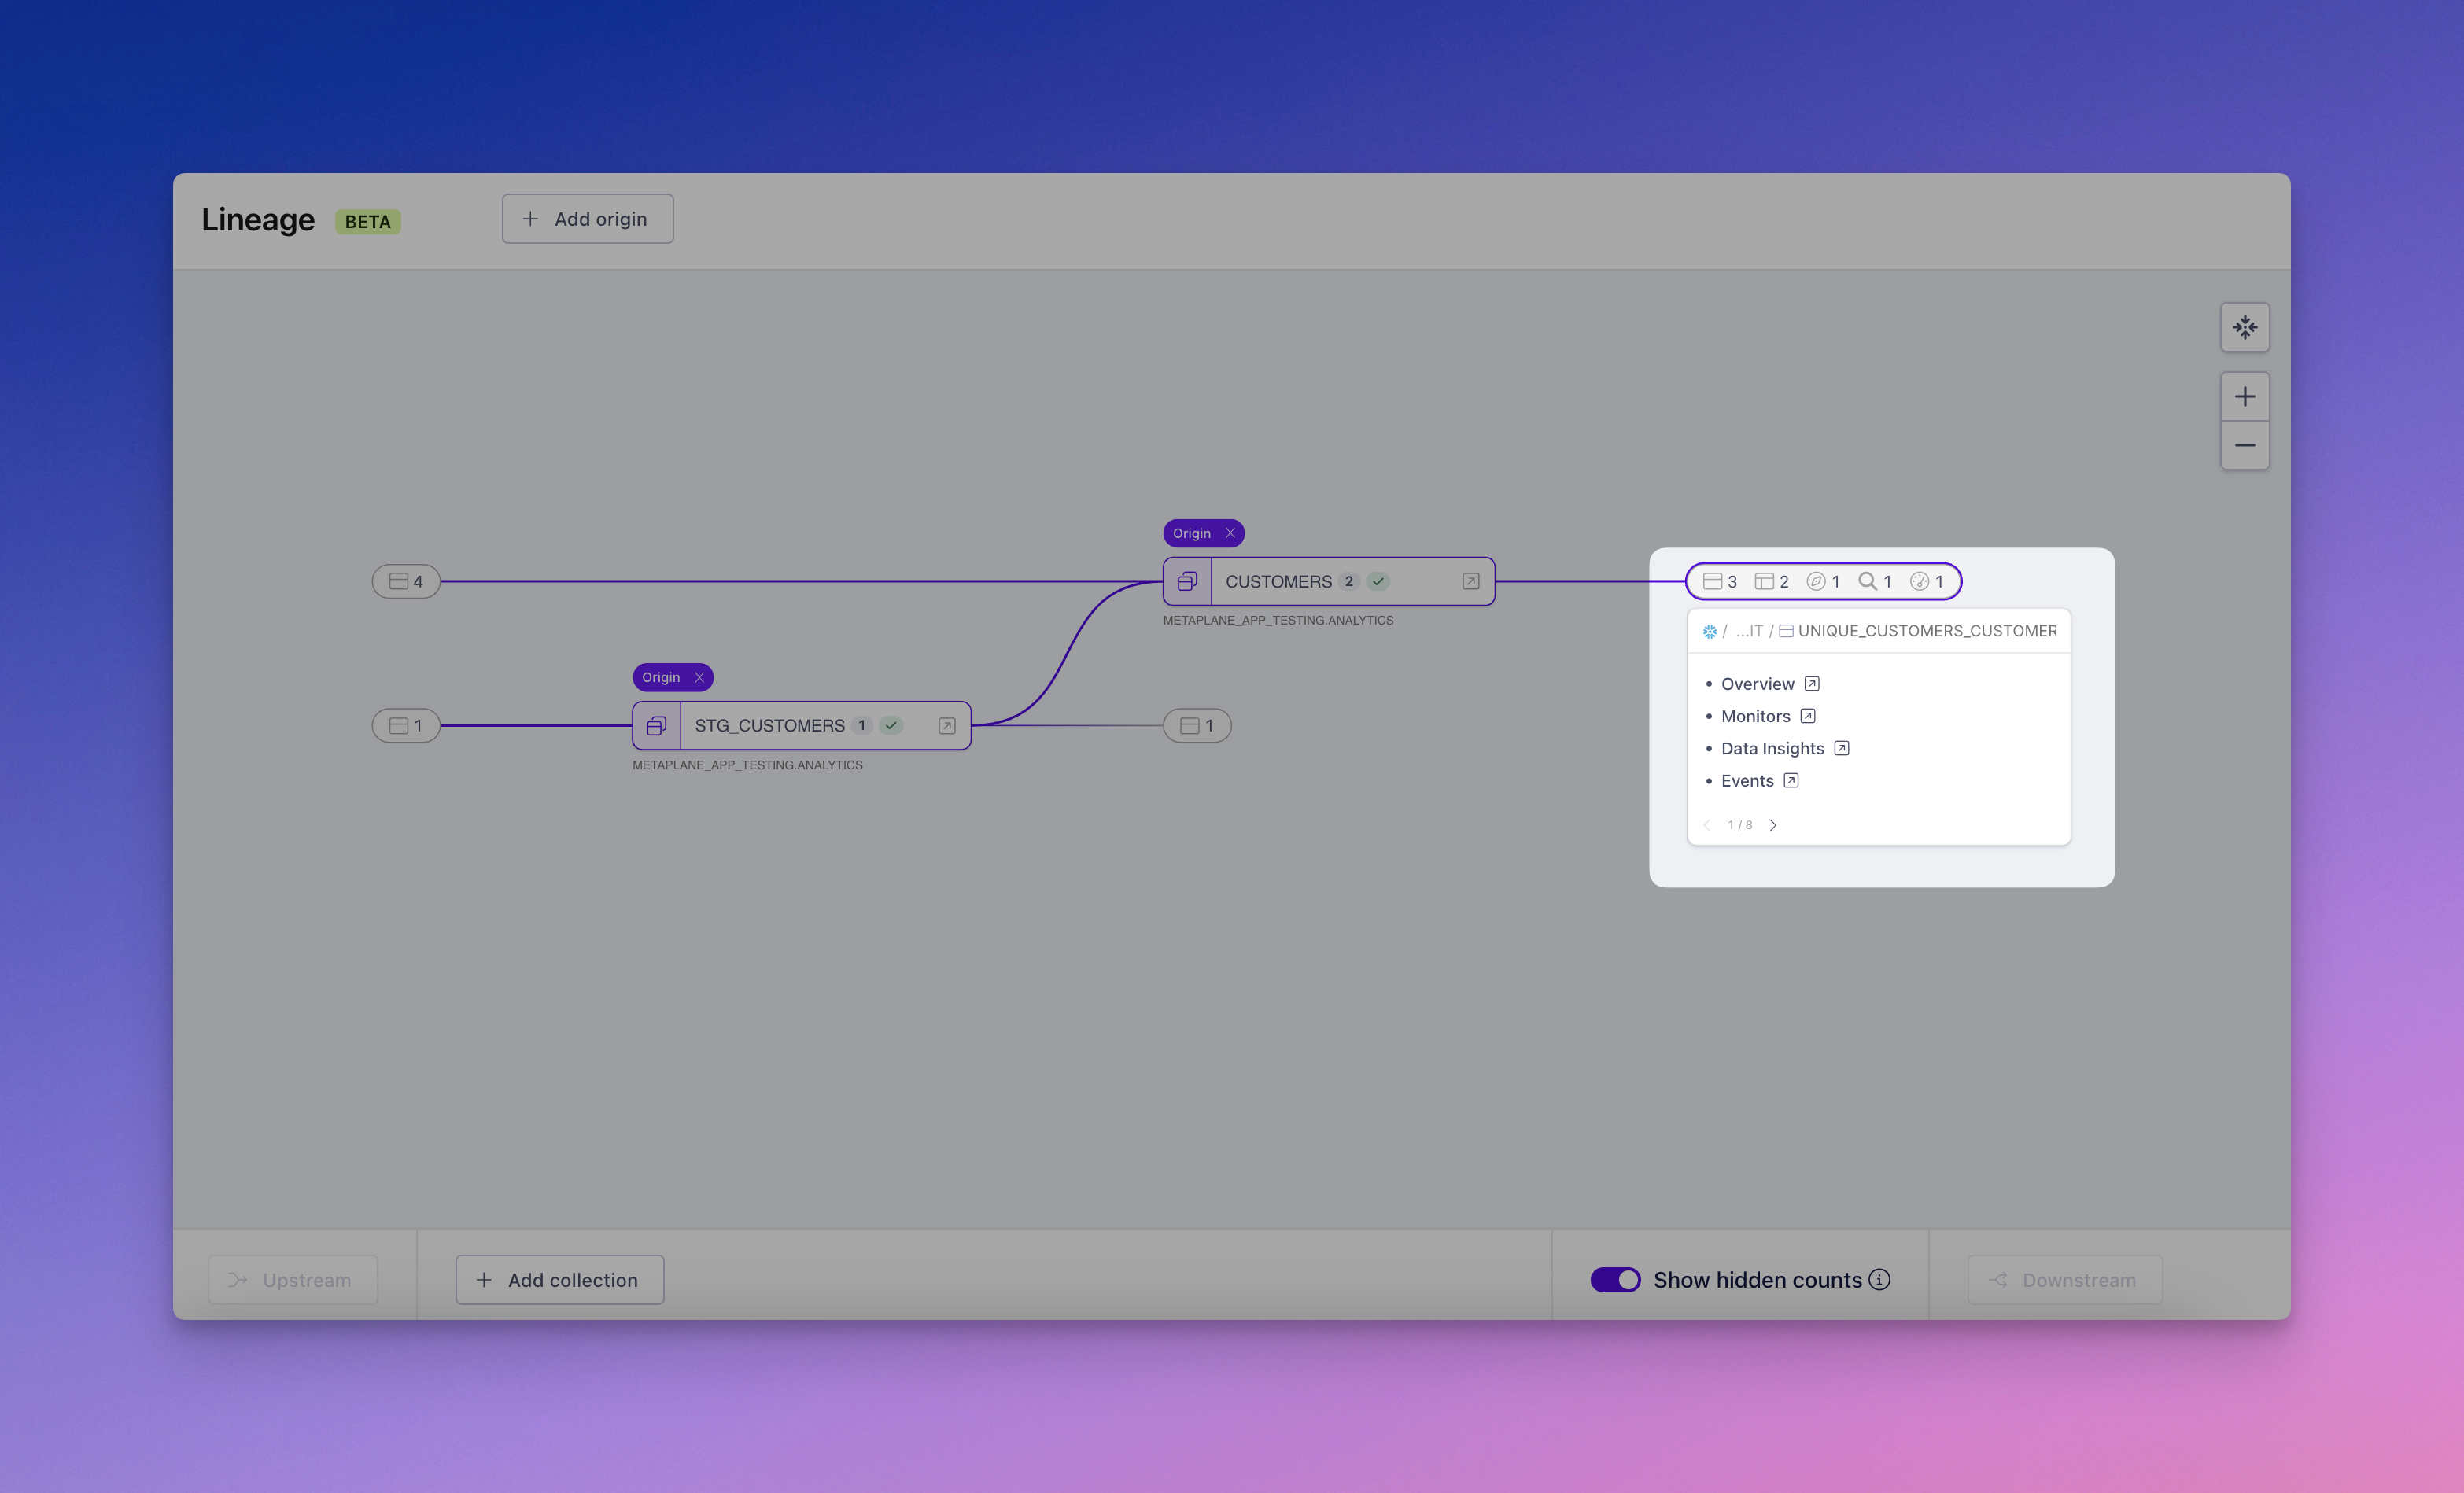
See details on hidden assets
Once you've selected an origin, you can click to see the details and links about assets hidden from view.
Use dashboard-style collections to filter assets
Scroll to the bottom of the page and click "Add Collection." A menu will open with various options—select one to add it to the lineage view.
Each collection is color-coded for easy differentiation. You can add multiple collections as needed.
You can view upstream and downstream assets for your collections using the controls on the bottom left and right. Click to see a list of assets or export a CSV. In the list view, select any asset to navigate directly to its source page.
Integrated warehouse Lineage
Switching to particular fields
Clicking the table name at the bottom of your screen will pull up a list of the columns within that table. Once you select your desired column, your chart will update to show where that field is referenced.
List view
In some cases, you'll have hundreds of downstream objects and tens of transformation models, which can be more easily sorted through a list. You'll be able to see both downstream objects and upstream objects in a list view, grouped by the number of "hops" (i.e. transformations, references in queries) they are away from your root object.
Updated about 1 year ago