

Configuring monitors
How to schedule monitors, add manual thresholds, and filter by rolling time windows.
Note that there are two places where you'll see monitor configuration options. Both places where you'll see configuration settings will offer the same options.
- Alongside monitor creation
- In the configuration pane outlined below
Configuration pane
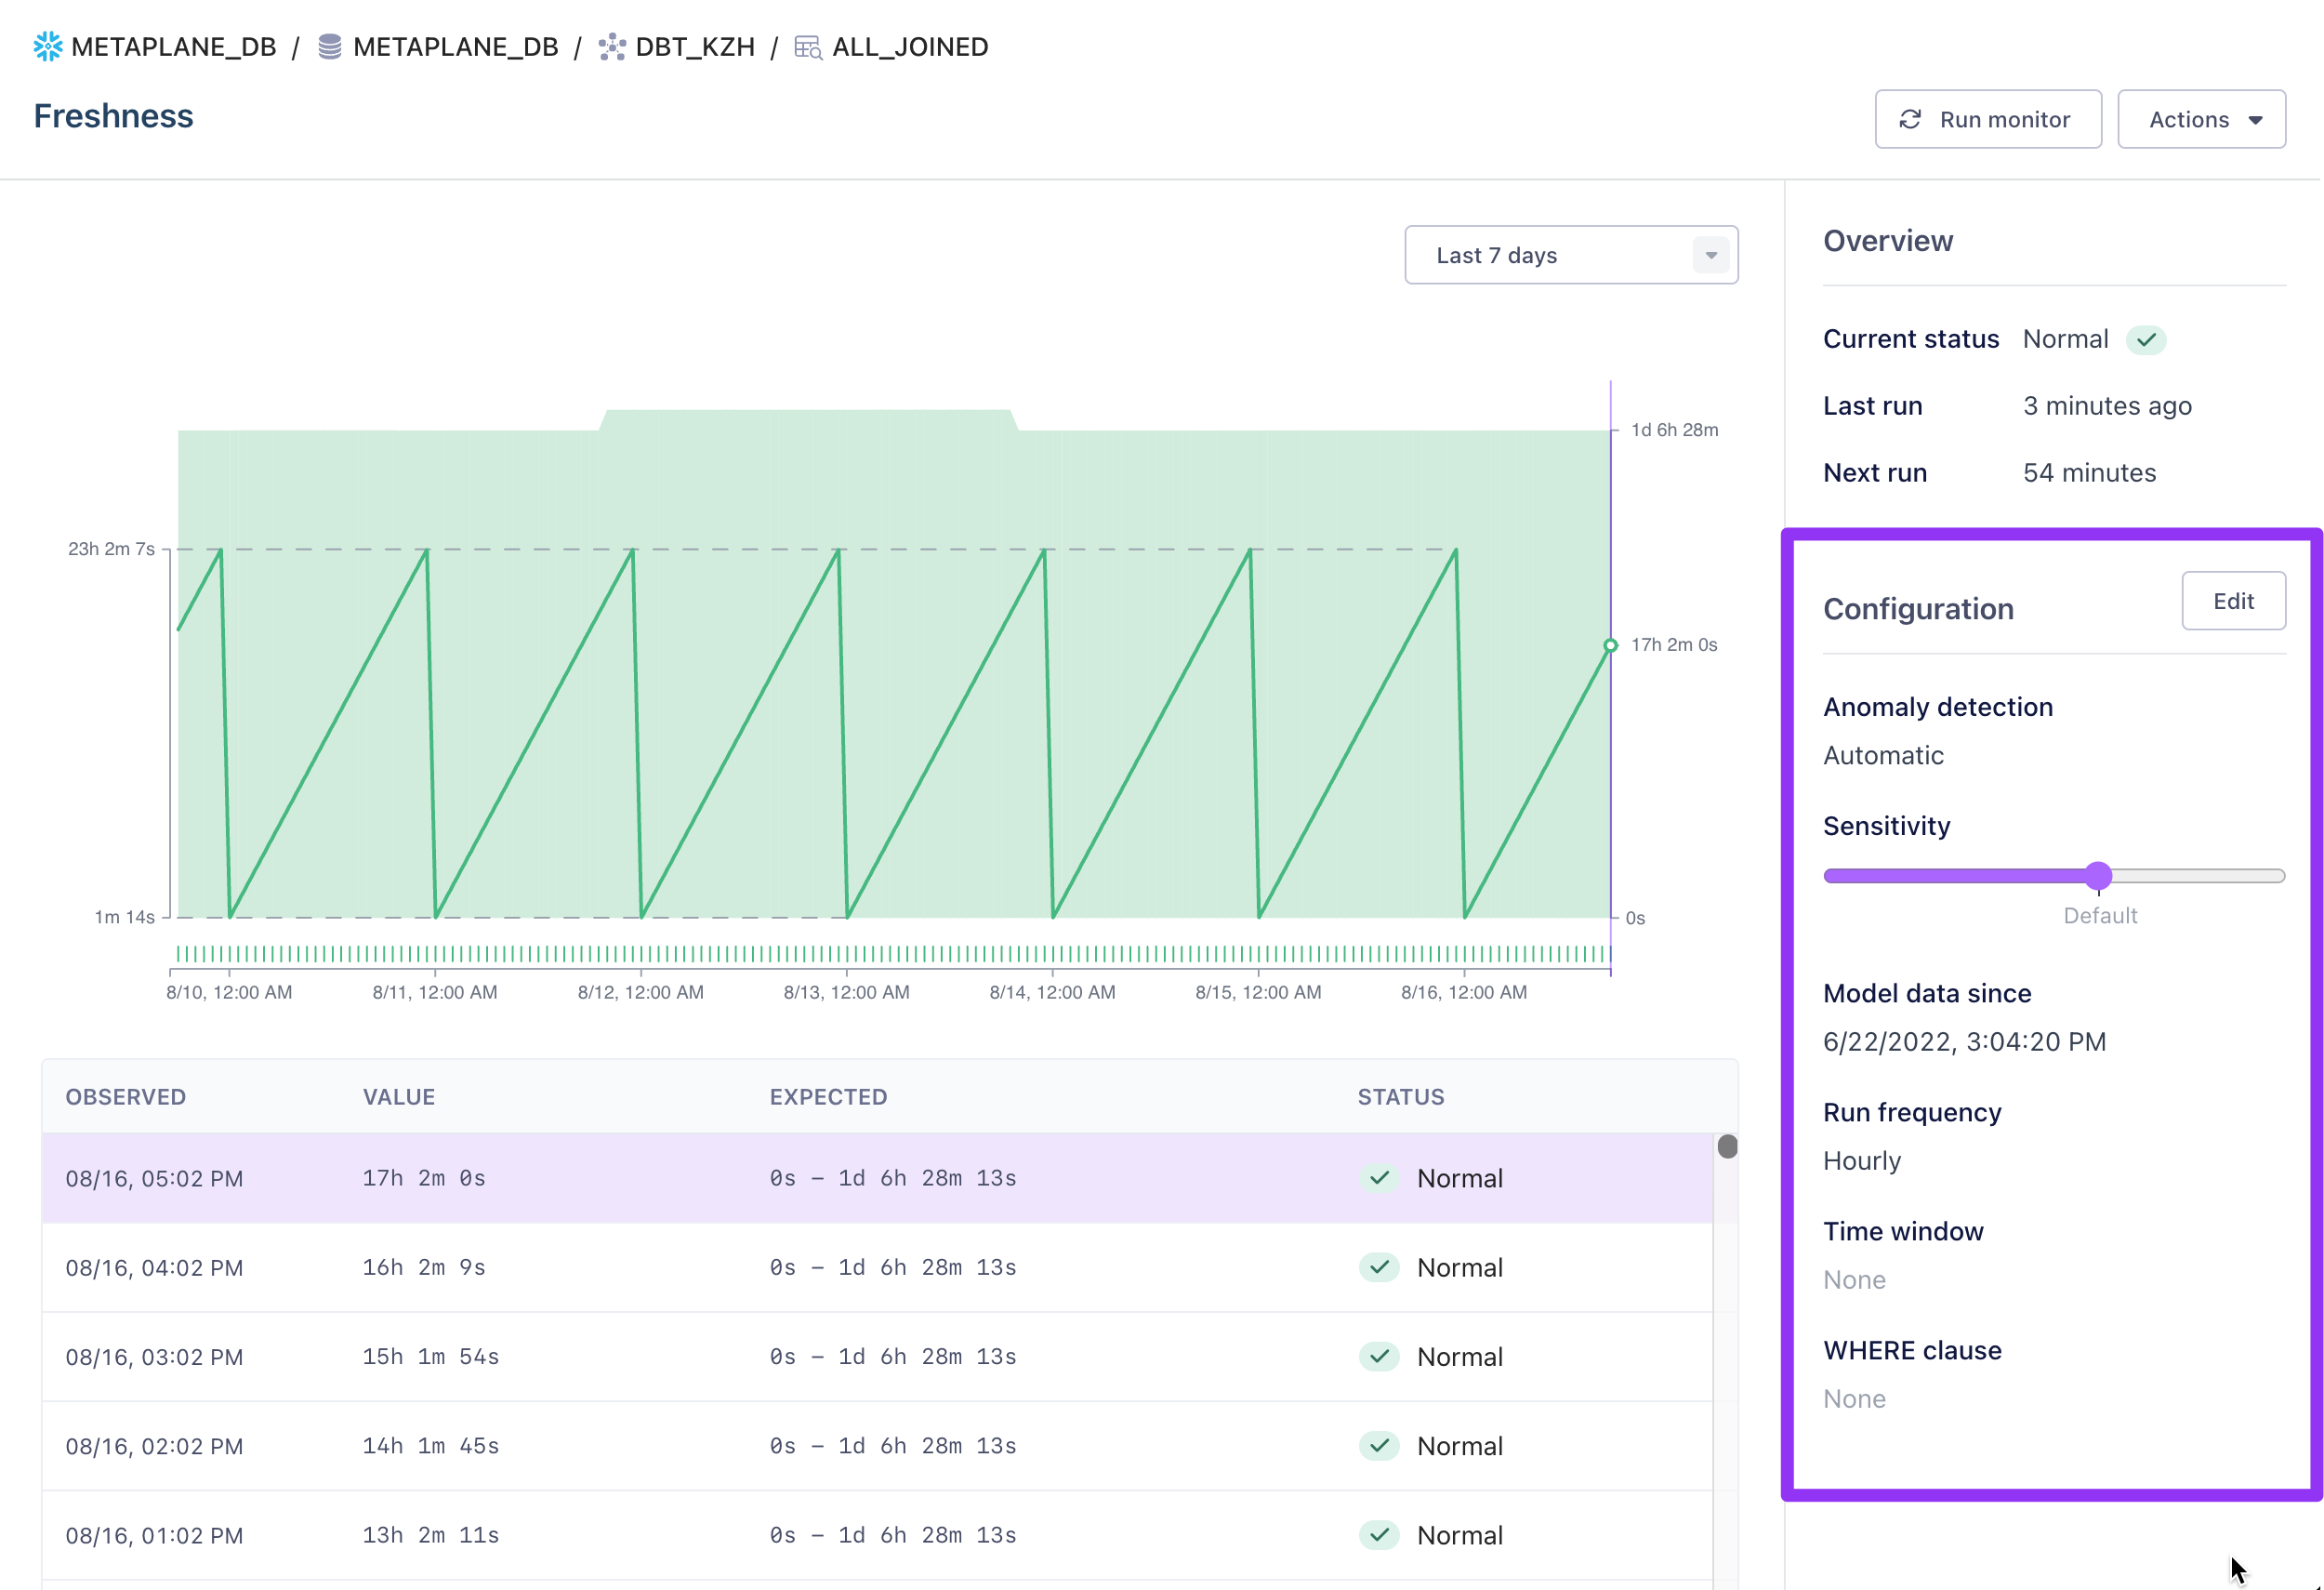
To start customizing a monitor, click into a monitor page and locate the configuration pane on the right hand side of the screen. This configuration pane will let you switch between automatic and manual anomaly detection, configure monitor sensitivity, configure monitor frequency, test based on rolling time windows, and/or specify which rows you want to monitor.
Anomaly detection
Metaplane offers two types of anomaly detection: automatic and manual.
Automatic anomaly detection is the default when you create a new monitor. With automatic anomaly detection, Metaplane will build a machine-learning model based on your historical data, then compare the values we observe to that machine-learning model. Automatic anomaly detection works best for tables or columns with periodic patterns, seasonality, and linear changes.
When using automatic anomaly detection, you can choose the period of time that Metaplane's models use in making their predictions in the Model data since field. By default the model uses the date that it began training, but there might be cases where you'd like to change this.
For example, let's say that the data in your table materially changed since the model first went through its training period. Maybe your team ran a huge backfill of data and now the row counts are off, or maybe your team cleaned up several duplicate records and the uniqueness spiked. In these cases, you may want to update the date in the Model data since field to be after the date the change happened. Then, in the next run, Metaplane will only use the more recent data to make its predictions.
Note: If you update theModel data since field, Metaplane may put the model back into training if it no longer has enough data to predict. This is more common if you update the field to a date that's less than 3-5 days from the current date.
Manual anomaly detection, on the other hand, relies on your understanding of the desired behavior for the underlying metadata through upper and/or lower thresholds you apply to the monitor. Manual anomaly detection works best for tables and columns where you have strict requirements about the desired behavior. Some examples might be:
- If you have columns that should never be null, you could set the upper threshold for a nullness monitor to 0%. This means that Metaplane will trigger an incident any time the nullness is greater than 0%.
- If you have columns that should always be unique, you could set the lower threshold for a uniqueness monitor to 100%. This means that Metaplane will trigger an incident any time the uniqueness is less than 100%.
- If you have a table that doesn't get updated on any fixed schedule, but really should be updated at least every two weeks, you could set an upper threshold of 14 days. This means that Metaplane will trigger an incident any time the the freshness for a table is more than 14 days old.
Sensitivity
The sensitivity setting lets you tune the expected range generated by the machine learning model.
Increasing the sensitivity will decrease the size of the model thresholds. This is perfect for instances where you want to know about more subtle variations in the values Metaplane observes. For example, let's say you have a distribution monitor to a column that’s critically important to some business logic, and you want to know about even minute changes to the standard deviation or mean. Increasing the sensitivity might be the way to go.
Decreasing the sensitivity will increase the size of the model thresholds. This is ideal for situations where you want to only get alerts about large variations in the values Metaplane observes. For example, let's say you have a table where it’s fine if the row count fluctuates a lot on a daily basis, but you’d want to know if it suddenly dropped to zero. Decreasing the sensitivity would enable this behavior.
Best practices for model sensitivityAs you begin to tweak the alert sensitivities for your Metaplane monitors, we’d recommend starting small. Adjust the sensitivity up or down a notch, then wait for the monitor’s next regularly scheduled run (or, if you want a quicker result, you can run the monitor manually). As the results come in, see if they’re in line with the adjustment you were hoping for, and if not, continue to tweak the sensitivity until it is.
Run frequency
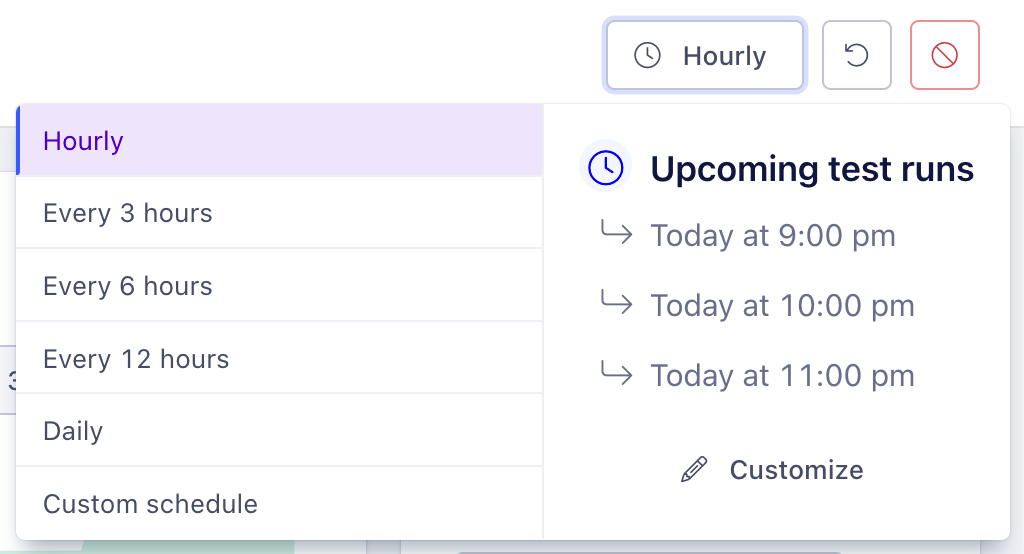
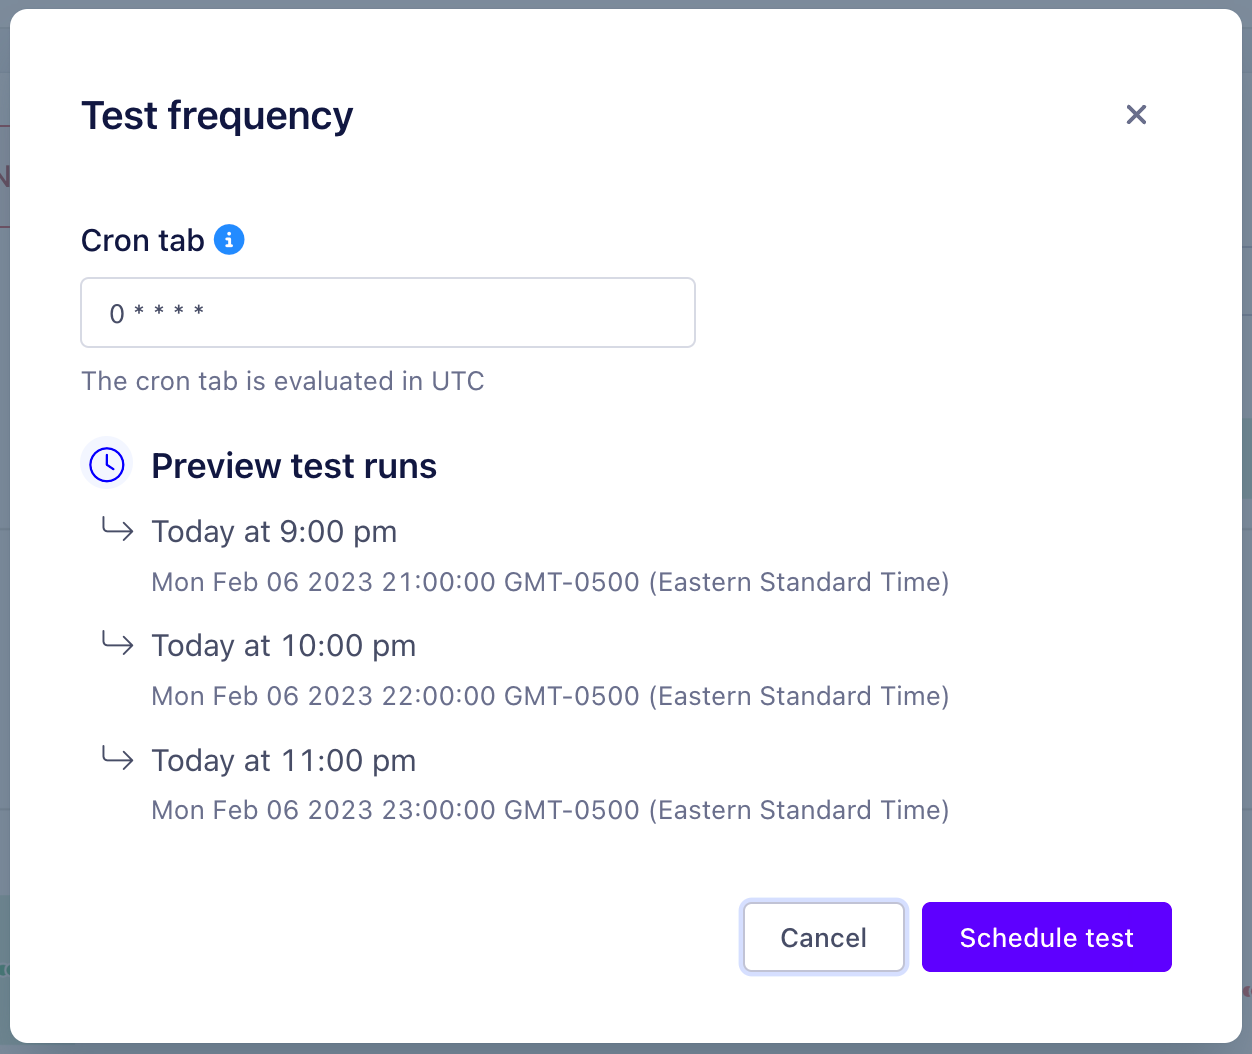
By default, Metaplane runs monitors every hour. You can change your organization wide default via the account page. When changing the schedule, you can pick from one of our pre-set options or fully customize it with your own custom cron schedule.
Rolling time window filters
Adding a time window filter to your monitor is a useful way to limit the total amount of data Metaplane needs to scan or ensure that old data isn’t being included in the observation. The monitor can be filtered by any datetime column on the table.
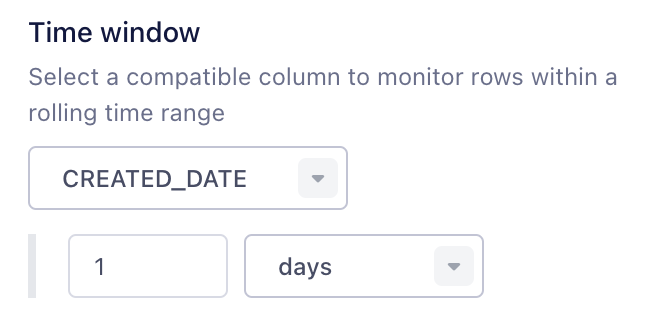
Once selected, this effectively adds a WHERE clause to the monitor’s sql to filter out an orders from more than a day ago. Note that the time window is rolling and not calendar based.
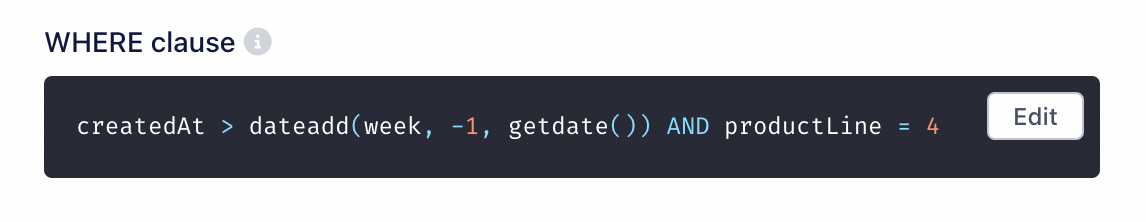
Custom WHERE
WHEREMetaplane also allows users to provide their own sql expression that we will add into the WHERE clause of the monitor, to focus improving data quality on your designated segments. This can be used independently or in conjunction with our other filters.
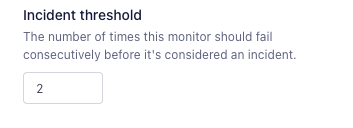
Incident threshold
In cases where it is normal to see occasional blips in the underlying data, you can configure the number of consecutive monitor failures that need to occur in order for the failure to be considered an incident.
Once the threshold is met the failure will either trigger the creation of a new incident or get associated with an existing incident, if appropriate
Naming Monitors
To help your team intuitively understand why monitors were created, you can customize monitor names in your specific monitor page.
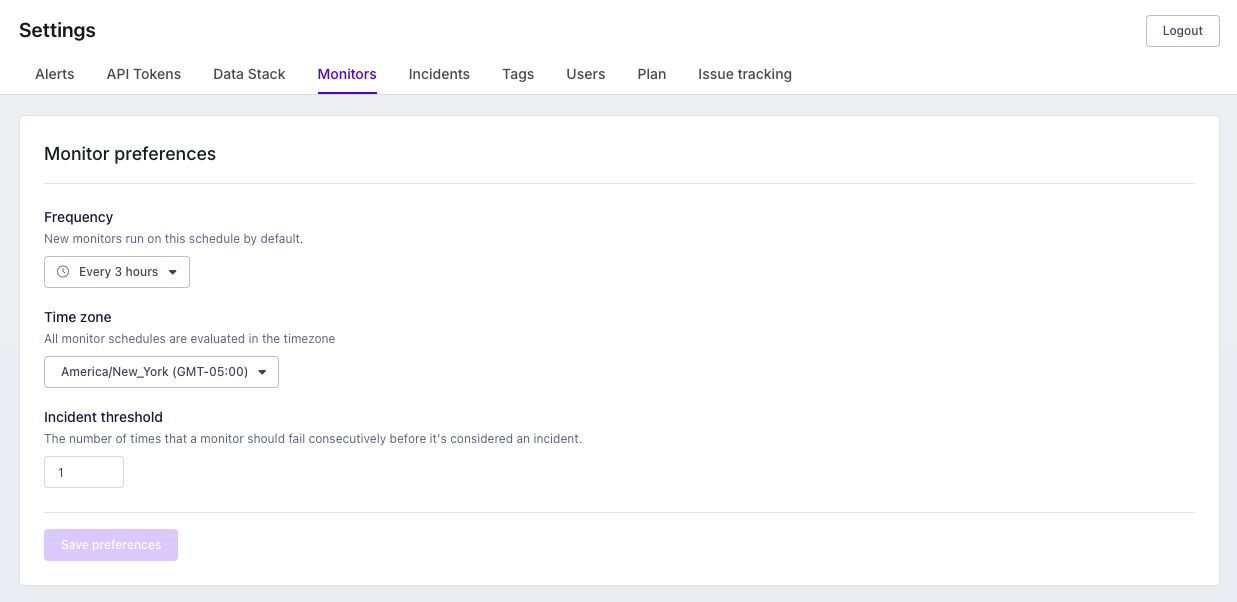
Global monitor settings
You'll be able to configure some universal monitor settings through the left hand sidebar.
- Frequency: You can create default run schedules for new monitors.
- Time zone: You'll be able to set the timezone for monitor setting here.
- Incident threshold: The default incident threshold that will be applied to monitors that don't explicitly set a threshold.
Monitor owners
Monitor owners help you understand who should be responsible for handling data quality incidents discovered by a Metaplane monitor. You can also configure owners to be mentioned in your integrated notification tool, such as Slack, through Alert mentions.
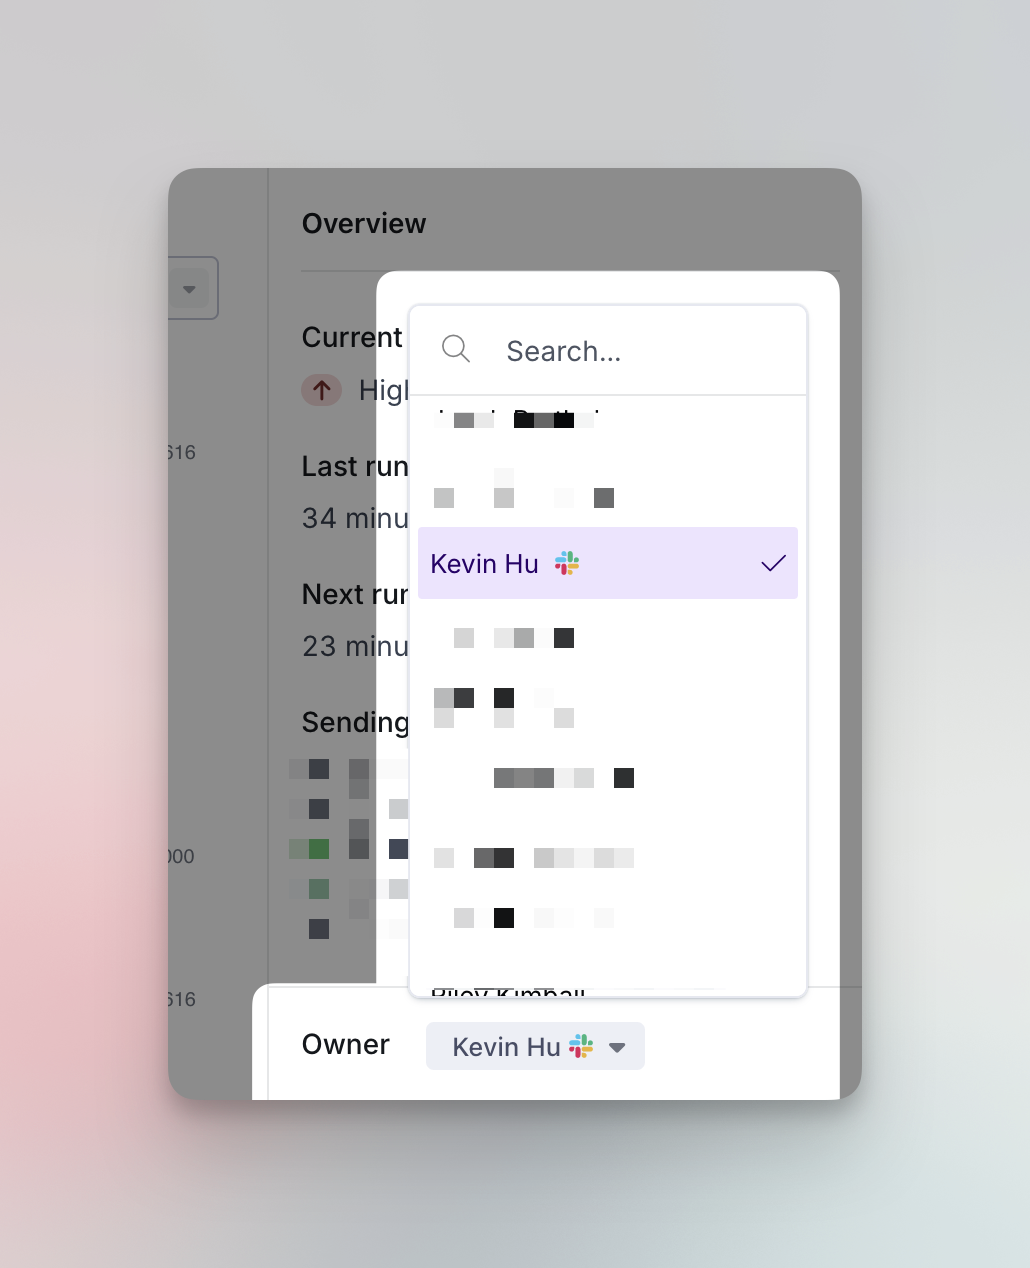
You'll be able to find the current monitor owner directly above the configuration panel and can assign owners from there. Note that owners with Alert mentions setup will have the corresponding integration logo next to their name. In the example above, "Kevin Hu" has his Slack mentions setup to be notified when an incident is triggered.
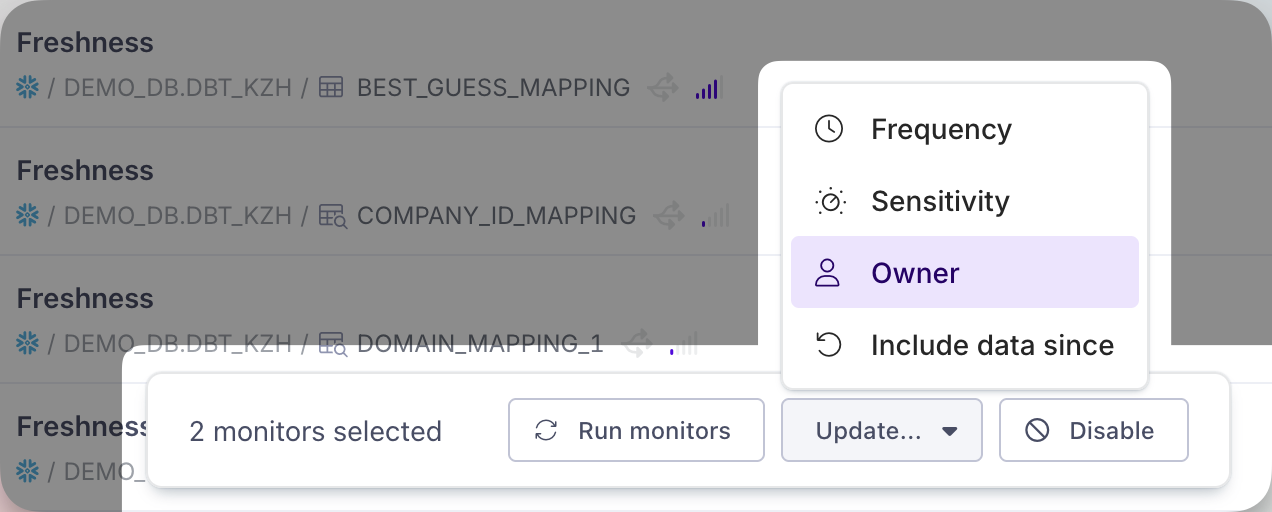
Bulk ownership assignment
From any monitors page, you'll be able to configure monitors and assign ownership using the dropdown as shown below.
dbt Owner syncing
Metaplane can assign a Monitor owner based on dbt ownership. We do this by matching the owners field in your dbt project.yml file to team members in Metaplane. You'll need to use that string when assigning owners.
Any dbt owner that is manually changed in Metaplane will not be synced again. If you want to resume syncing, just set the owner to "none" and it'll be re-synced on the next sync. Both dbt core and Cloud are supported.
Model type (for Custom SQL monitors only)
Each of Metaplane's monitor types uses its own, custom-built machine learning model. Those machine learning models are finely tuned in order to catch the specific types of anomalies that tend to crop up for that monitor type. So, for example, the model that powers our row count monitors are specifically built to catch sudden spikes or drops in the number of rows, or to notice when an increasing trend suddenly goes flat. The model that powers our freshness monitors is specifically built to take seasonality trends into account for the freshness of a given table or column, and to notice when the freshness creeps up above what we'd expect for that particular day. And so on.
The one exception is the models that power Metaplane's custom SQL monitors. Because custom SQL monitors are incredibly flexible, letting you monitor anything that you can express with SQL, the monitor uses a more general-purpose anomaly detection model. But sometimes, the custom SQL monitor that you've set up would better be served by one of Metaplane's other model types. If, for example, you're returning the sum of a set of values in your custom SQL monitor, you could use the "Sum" model instead. Or if, for example, your monitor is tracking the uniqueness of a combination of several columns, you might want to use the "Uniqueness" model instead.
In order to apply a new model, simply choose the model you want to use under the custom SQL monitor configuration options.
Because misapplying a model type on your custom SQL monitor will likely result in less accurate anomaly detection, we recommend sticking with the default custom SQL model if you're not entirely sure which model would be best for your use case.
Updated about 1 year ago