

Dashboards
With dashboards, you're able to see the information most relevant to you - whether that's objects related to marketing analytics or critical outages that'd impact executive reporting.
Dashboards provide a customizable and collaborative space to organize key metrics, monitor statuses, and gain actionable insights tailored to your role. With dashboards, you're able to see the information most relevant to you—whether it's objects related to marketing analytics or critical outages impacting executive reporting.
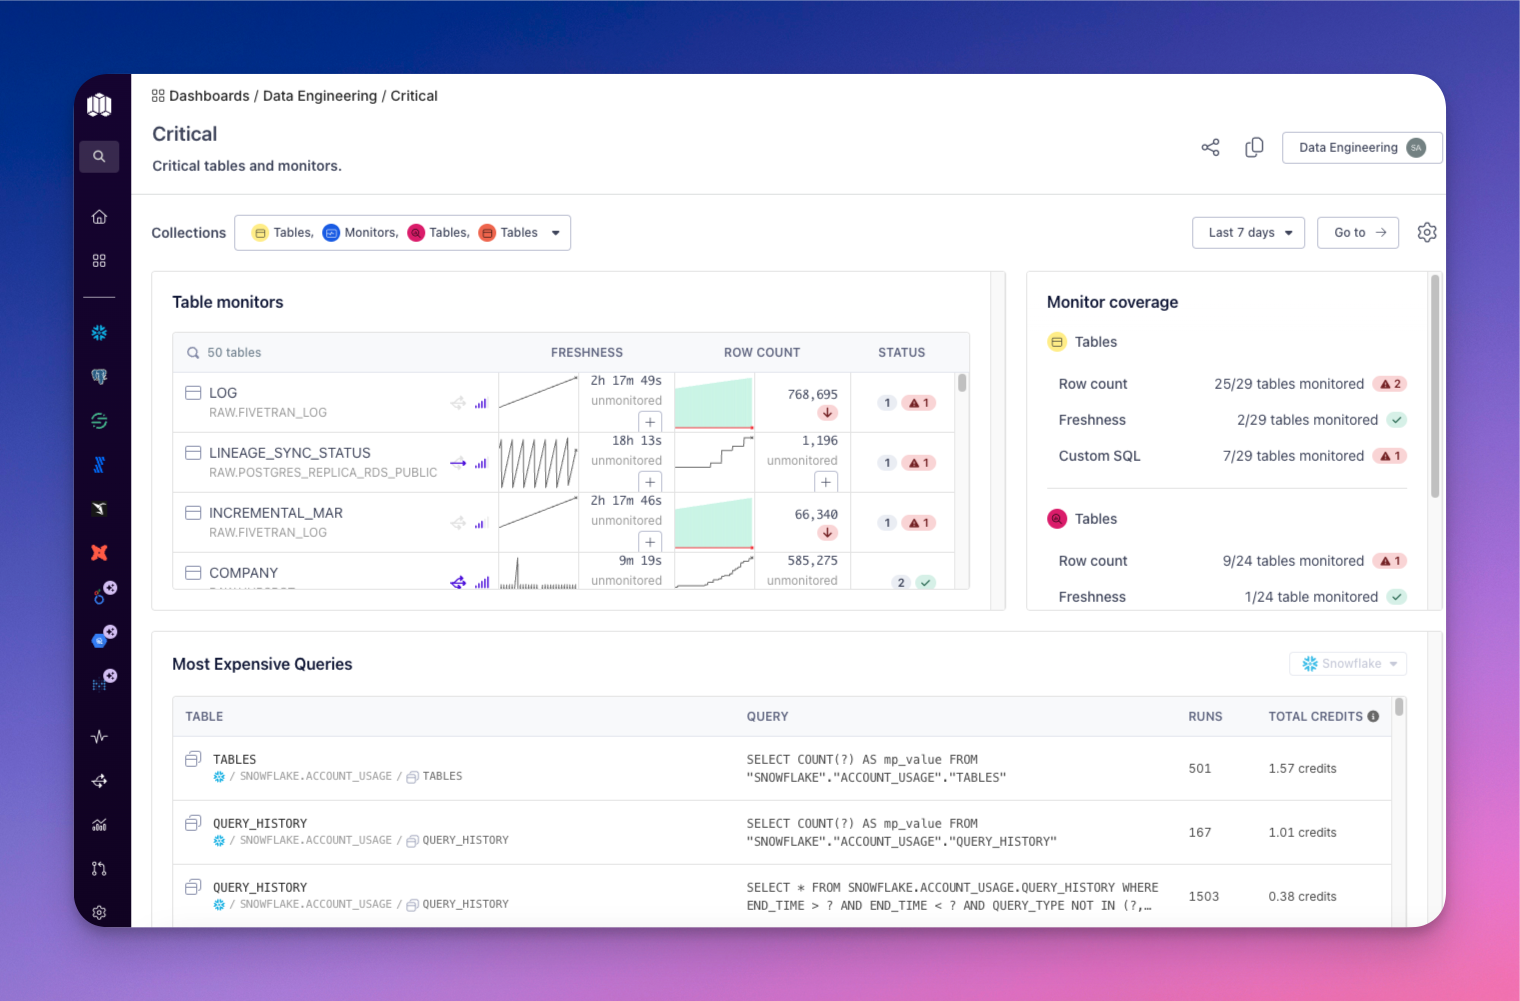
Collect tables relevant to your daily workflows into a dashboard and view the health, monitor coverage, and expensive queries run against these tables in one place.
Key Use Cases
Individual Users
- Create Personalized Views: You can build custom dashboards aligned with you and your company’s unique workflows and mental models. These dashboards improve efficiency and clarity by enabling quick access to the data and monitors most relevant to your responsibilities.
- Share Useful Dashboards: When a personal dashboard proves particularly effective, you can easily share it with others to promote shared understanding and best practices.
Teams
- Collaborative Monitoring: Teams can create shared dashboards that serve as a common perspective on key data and metrics. These dashboards facilitate collaboration during planning sessions, root cause analysis, and incident triage.
- Consistency Across the Team: Shared dashboards help establish a unified understanding of the data landscape, fostering better communication and alignment among team members.
Admins
- Assign Dashboards to Teams: Admins can assign specific dashboards to particular teams, ensuring that each team has visibility into the data, metrics, and monitors most relevant to their responsibilities.
- Simplify Views for Teams: By assigning dashboards and limiting unnecessary global views, admins help reduce information overload and allow teams to focus on what matters most for their role.
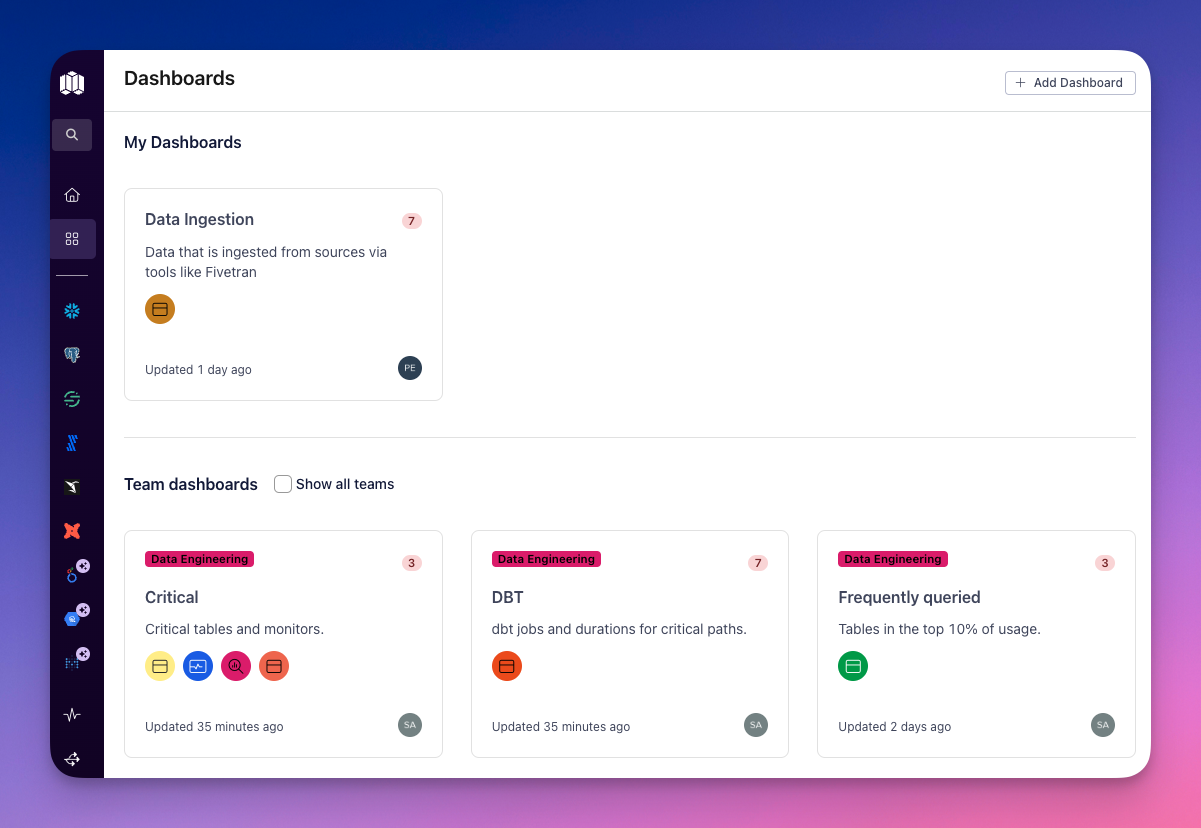
Personal and Team dashboards
Dashboards can be personal or team-based, catering to different needs. Team dashboards enable collaboration by allowing teams to share collections, monitor them collectively, and align on quality standards, breaking down silos and fostering shared understanding. Personal dashboards, on the other hand, are tailored to individual workflows, helping users align with their mental models and work more efficiently. Together, these options ensure that both individual and team goals are supported.
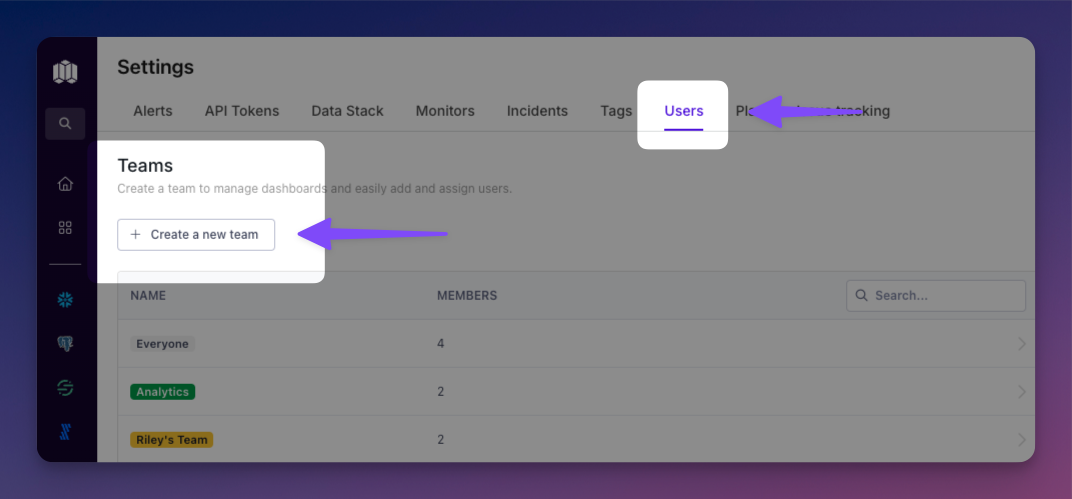
Teams can be created by going to Settings >> Users
Creating a custom dashboard
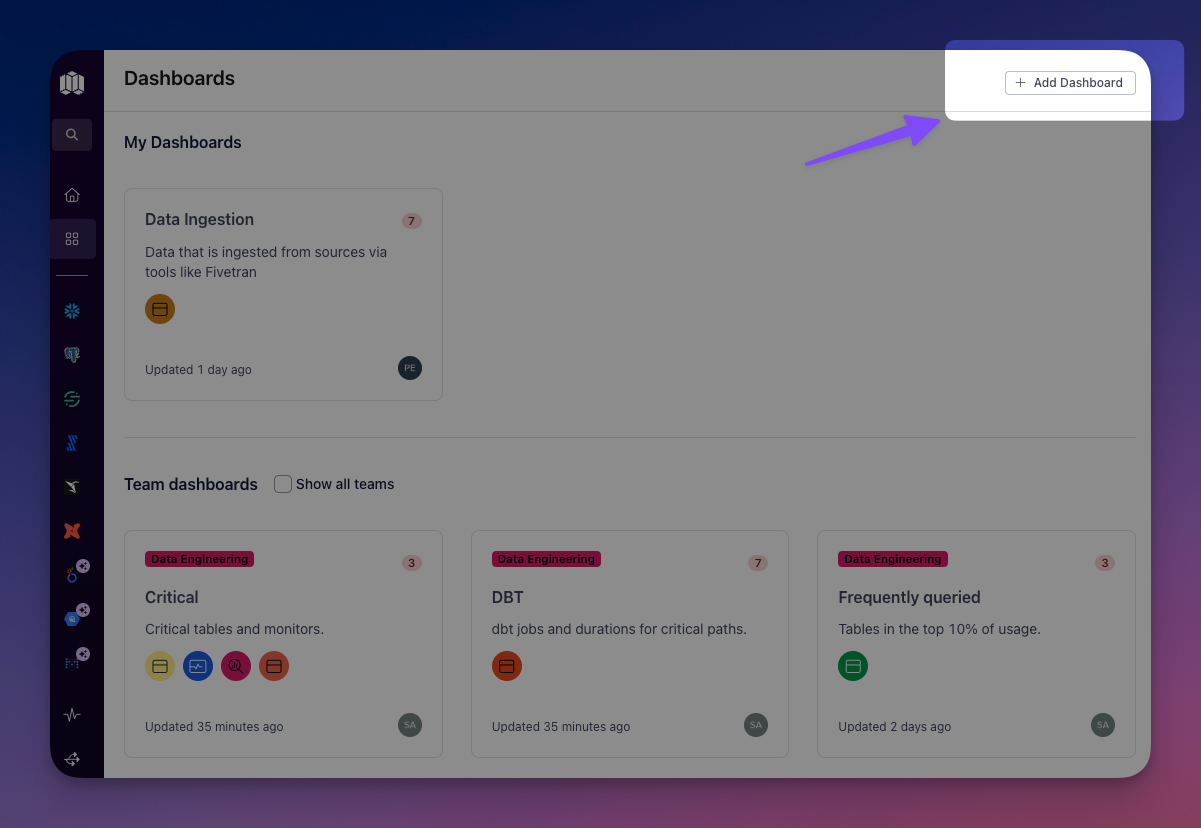
To create a custom dashboard, navigate to the dashboards overview page and use the “+ Add dashboard” button in the top right corner of the page to begin.
Views
In the first step, you’ll populate your dashboard with views. A View is a chart, graph, or table that displays a specific section or subset of data. There are a variety of views to choose from, displaying key metrics, monitor statuses, incident summaries, and trends.
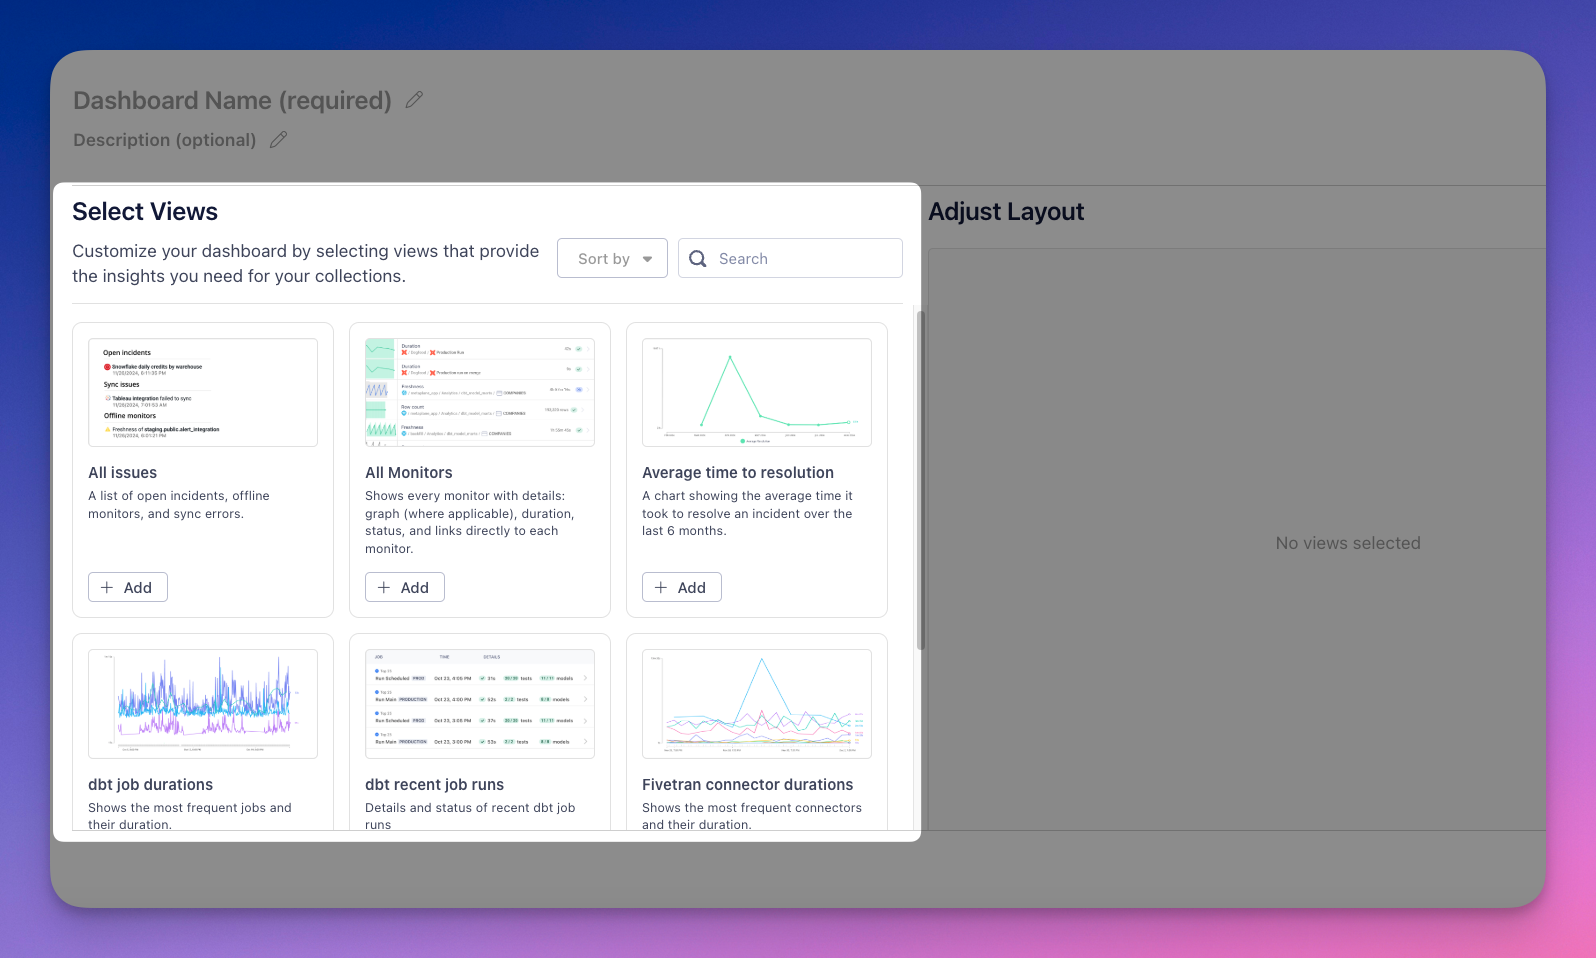
Adjust the size and location of views in the right side panel. Don’t worry, you can always come back later to resize, move, add, or delete views.
Collections
Once you’ve chosen your views, it’s time to create your collections. A Collection is a group of tables or tagged monitors that are important to you and your team. Collections enable data teams to define, create, and organize sets of key entities to suit their workflows and priorities. Whether you're tracking high-priority monitors, frequently used tables, or other critical resources, collections provide a flexible way to keep everything organized and easily accessible. You can create as many collections as needed, ensuring that your data environment aligns with your specific needs and responsibilities.
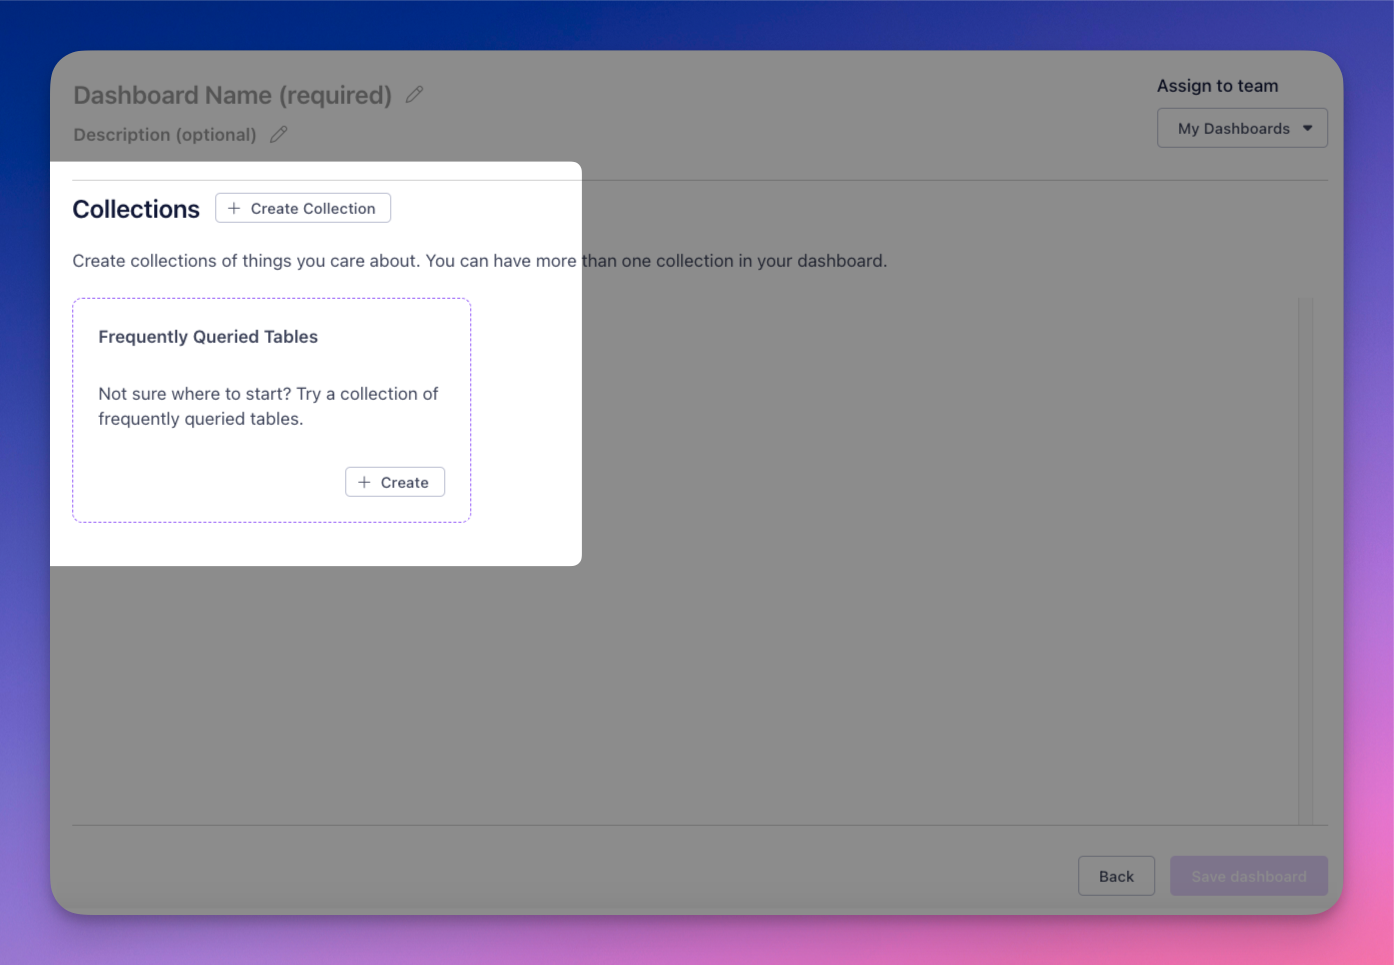
You will see a collection recommendation (or recommendations) based on the views you selected in the first step. Clicking the “+Create” button on one of these recommendation cards will automatically add that collection for you. You can edit a recommended collection by clicking on the settings icon in the top left.
Create custom collections using the “+ Create Collection” button. There are two options for creating a collection, Tables or Tagged monitors.
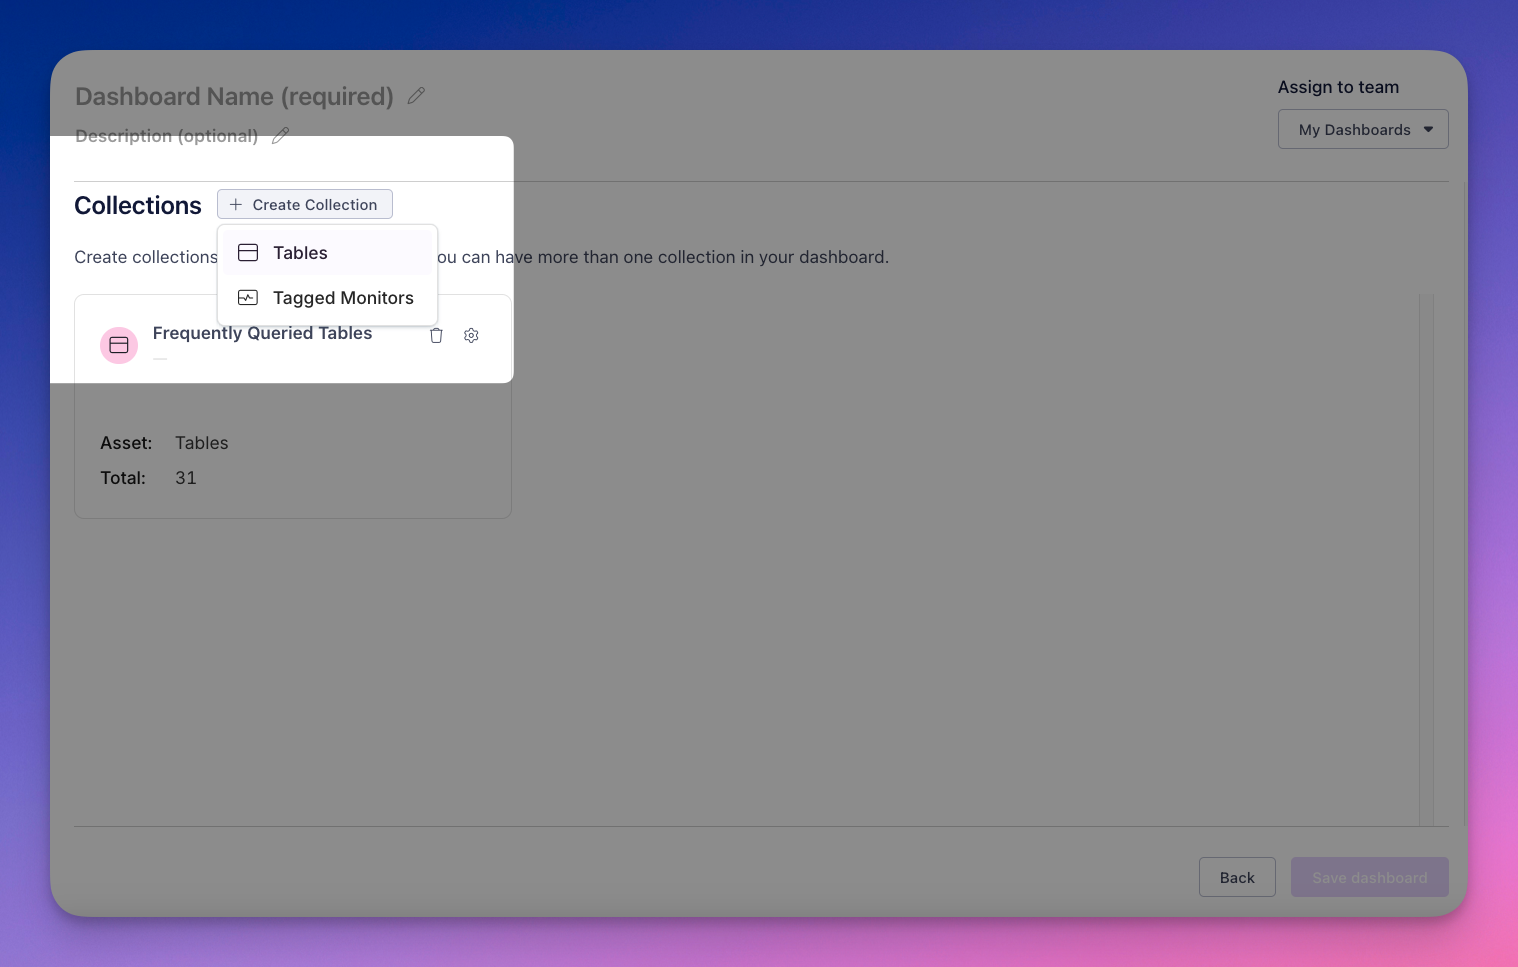
Table collection
When creating a collection of tables, you define criteria to specify which assets should be included. There are a number of criteria to choose from:
- Metric Value: Tables with metrics matching specific ranges and values. These include, row count, column count, freshness, and bytes.
- Monitoring: Tables that do not have a monitor.
- Properties: Tables with characteristics including, with name, with score, is table. is view and tagged with.
- Lineage: Tables based on upstream and downstream dependencies including connectors, data sources, jobs, tasks, workbooks, other tables, and more.
- Relationships: Tables in a specific database or schema.
- Data insights: Tables with usage or queried by a specific user.
From here you can further refine your collections using nested criteria as well as and/or statements.
Tagged monitors collection
Metaplane Tags help you organize and prioritize your data assets by attaching descriptive labels, or "tags". Tags are a powerful way to send relevant alerts to the right people and more quickly understand the impact of data incidents. You can learn more about tags here.
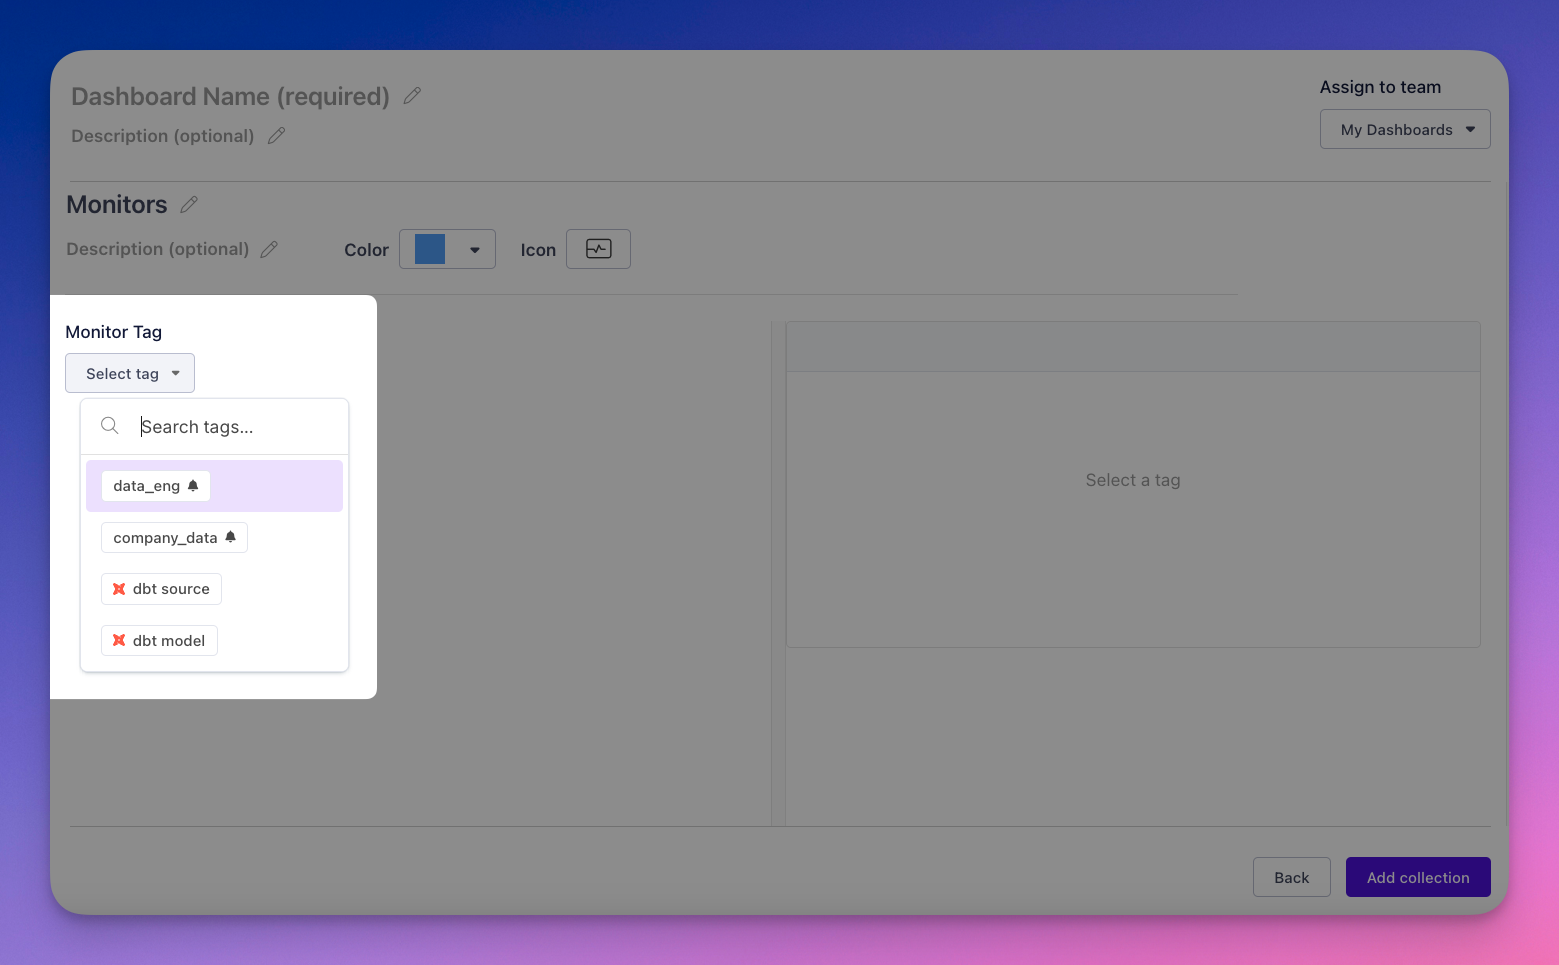
Creating a collection of tagged monitors is as easy. Simply choose the tag associated with the monitors you care about. Collections may only contain one tag but you can create as many unique tag collections as you need.
Naming and ownership
To create and save a dashboard, you must provide a name. You can also include an optional description to give an overview of the dashboard's purpose. Both the name and description can be updated anytime after the dashboard is created.
By default, dashboards are assigned to your personal dashboard. You can change this assignment using the dropdown in the upper-right corner, where only teams you belong to will be listed.
Editing sharing and duplicating
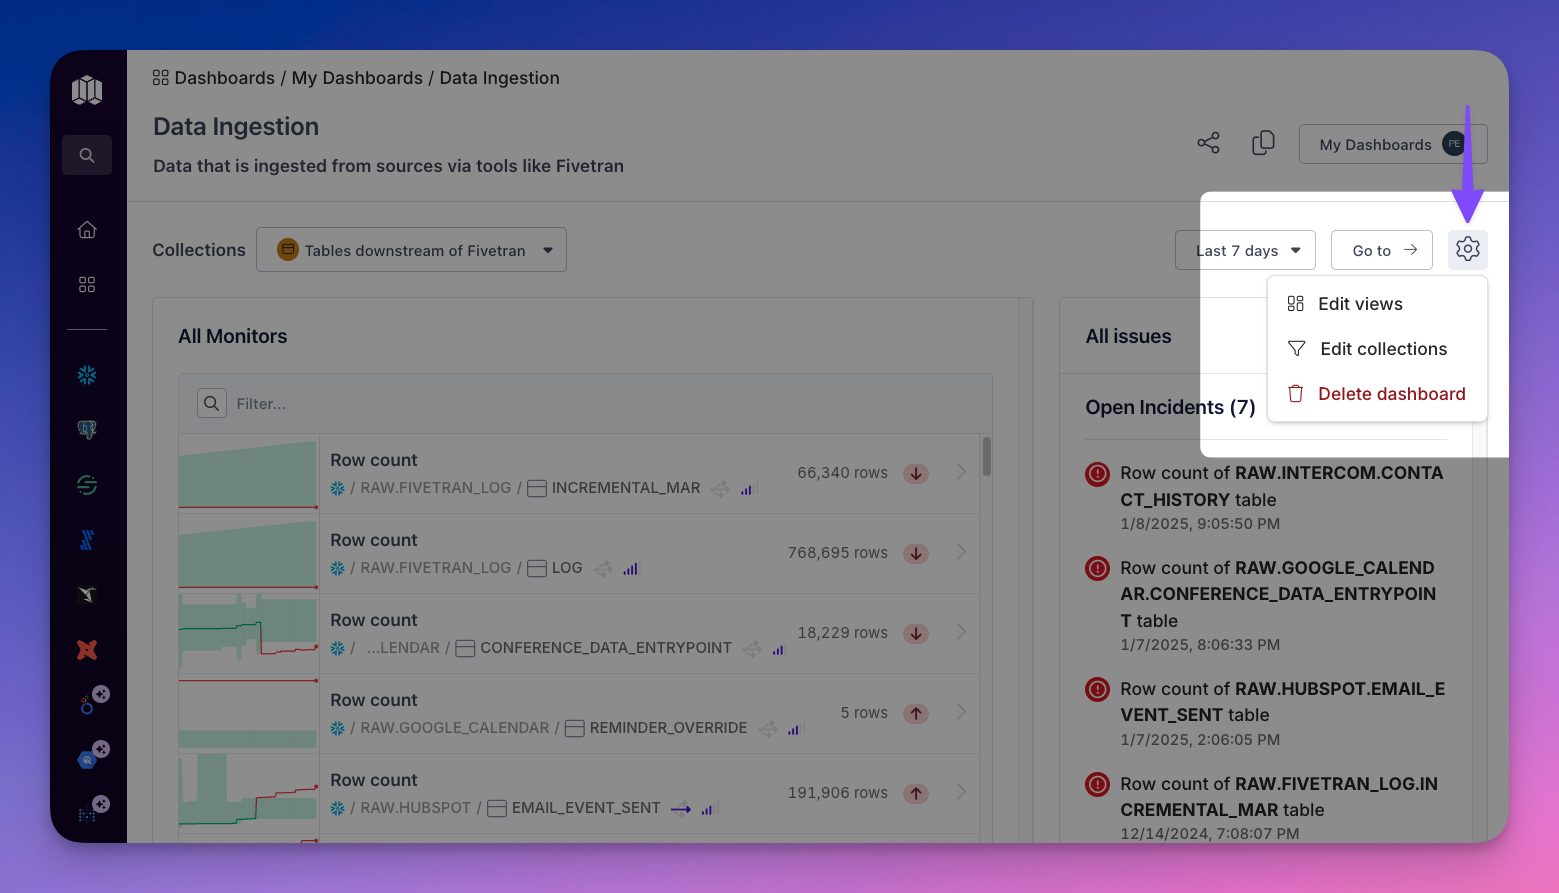
Editing your dashboards is simple. Click the gear icon in the upper-right corner of your dashboard to edit collections, adjust views, or delete the dashboard.
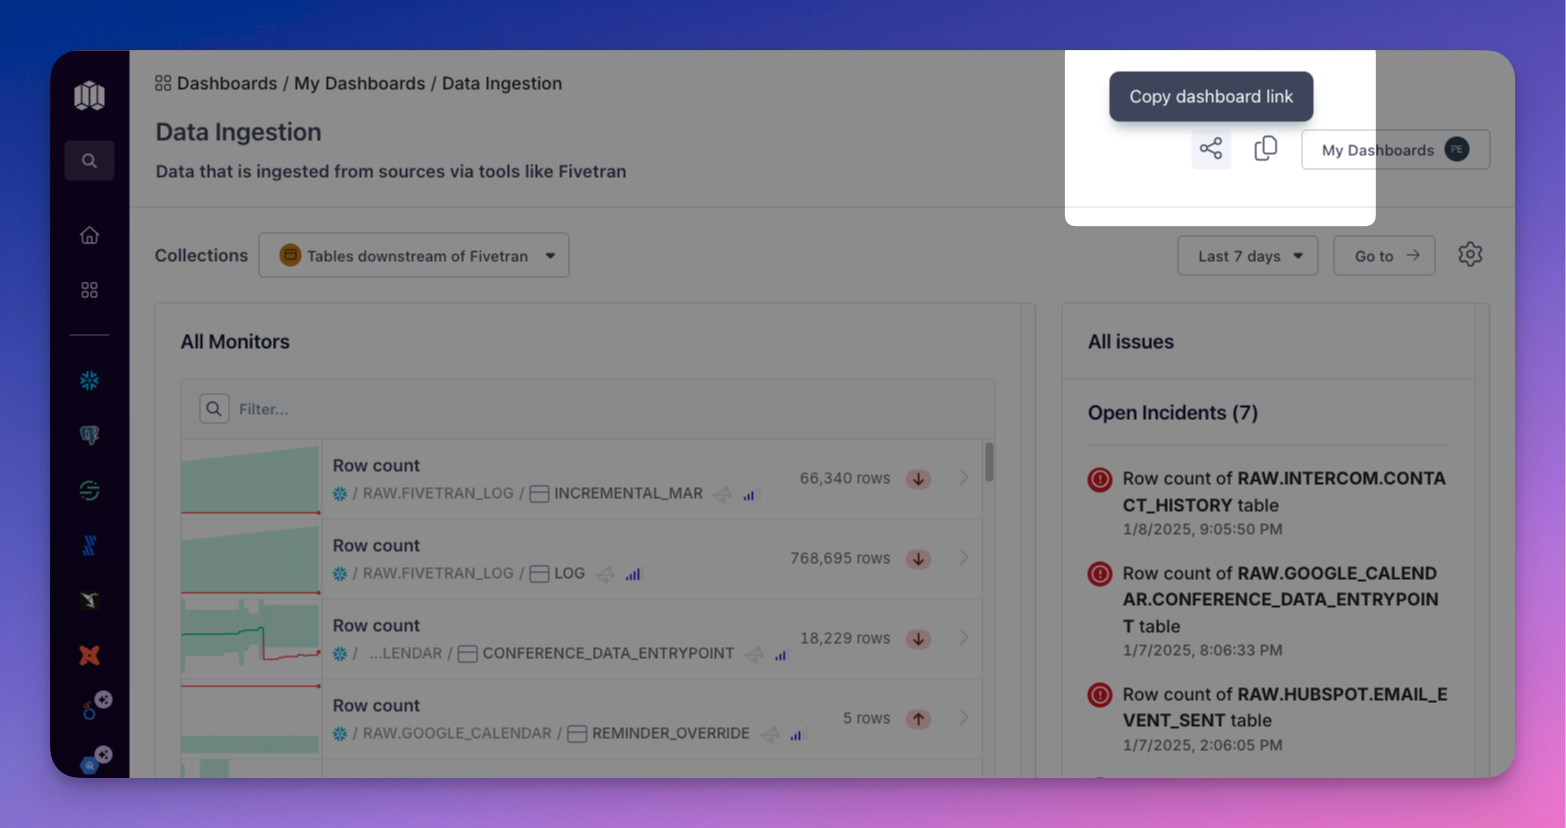
To share a dashboard, click the share icon to copy a link that you can easily paste into Slack, Teams, or send via email.
After setting up a dashboard to your liking, you can easily duplicate it using the duplicate flow. This creates a copy saved to your personal dashboard, where you can adjust views and collections as needed. Once edited, you can assign the duplicated dashboard to a team if desired.
Automatic Refresh
The Automatic Refresh feature ensures your dashboard displays up-to-date data without requiring manual updates. Once enabled, it refreshes automatically at predefined intervals.
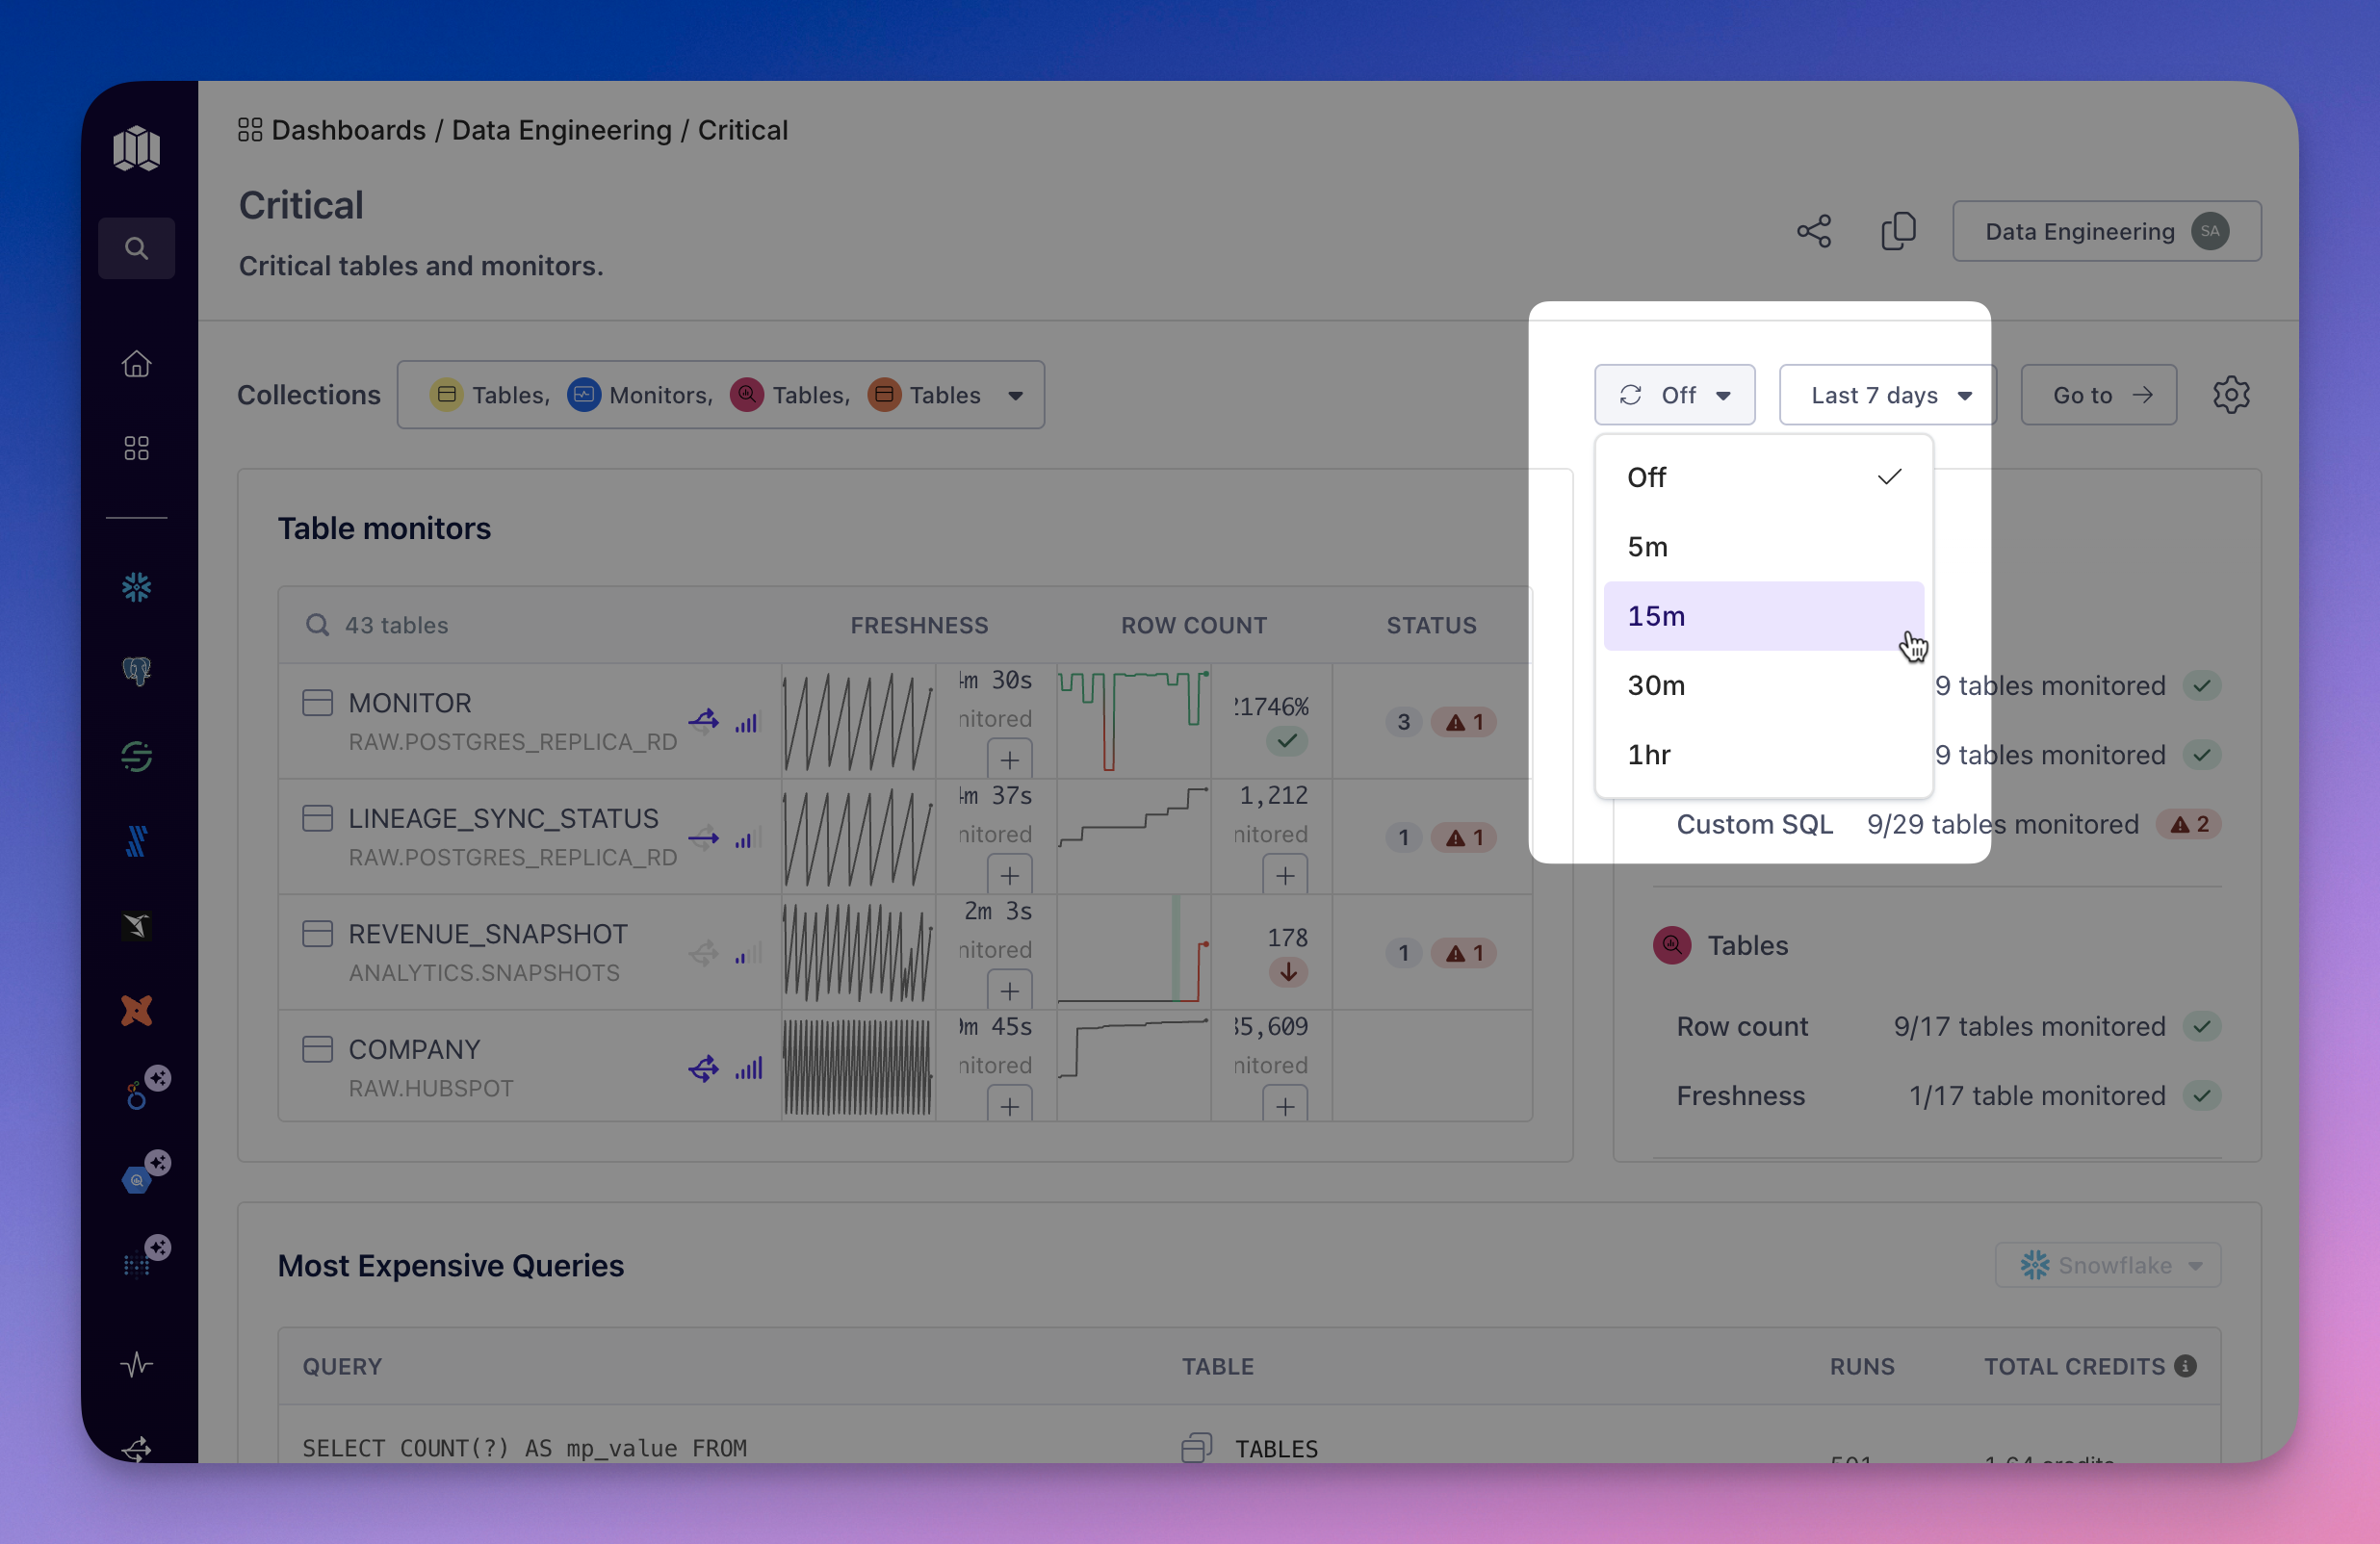
This is especially useful for keeping a dashboard open in a background tab or displaying it on a shared screen in the office, ensuring the data stays current. The refresh interval is saved in the URL, allowing you to bookmark it and easily revisit the dashboard with the same settings.
Updated about 1 year ago