

Incident Management
This page is intended to be done after your initial setup, after you’ve gotten your first data quality incident alert. It will walk you through what you should expect to see in an alert, what it means to mark the data point as normal, and Metaplane context provided to resolve the incident.
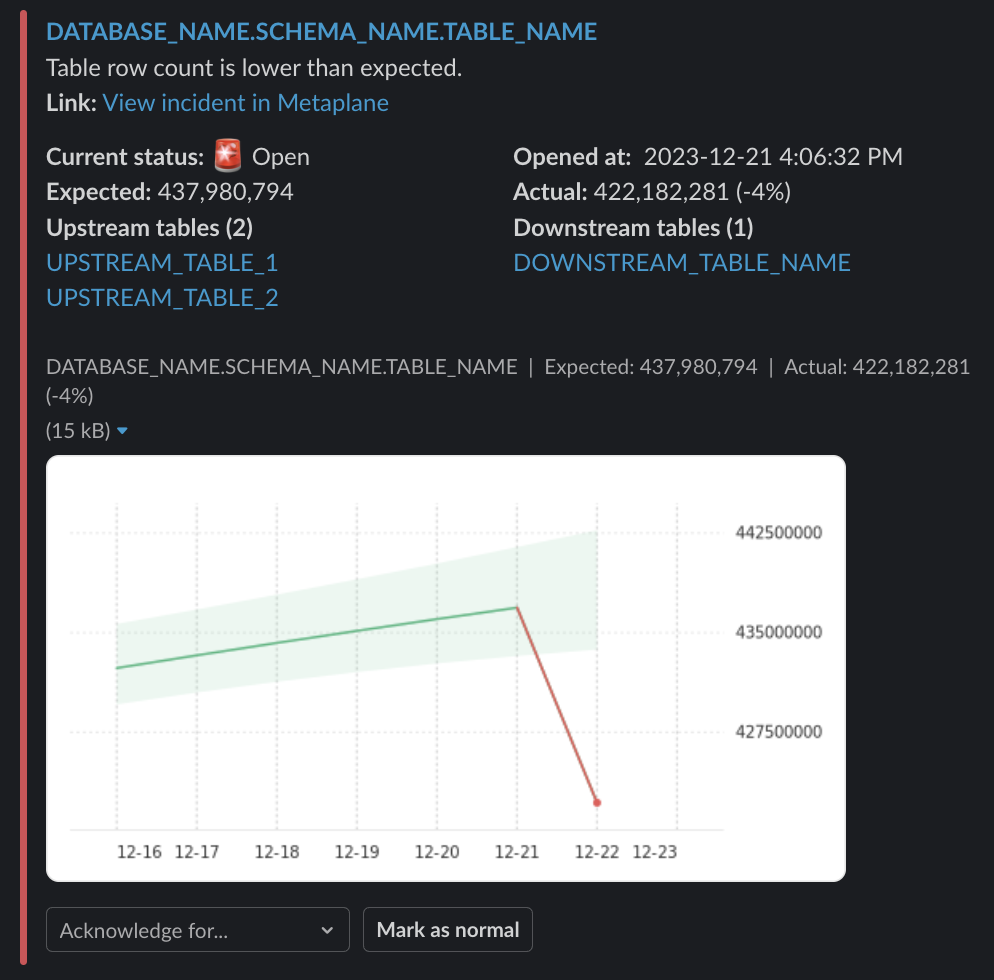
This is what an alert looks like in Slack, though similar information will also be displayed in Microsoft Teams.
-
(Optional) If the incident was expected as a result of a change that you knowingly made, you’ll be able to mark the data point as normal by using the “Mark as Normal” button at the bottom of the incident. Doing this informs the data model to adjust with this latest information to reduce the chance of future false alerts.
-
Click “View incident in Metaplane” to view the incident in your Metaplane account. You’ll be able to use the number of Downstream objects (including business intelligence dashboards and tables), found on the left hand side of your screen, as a proxy for the severity of the incident, so that you can prioritize your incident resolution work. You should also identify users of any downstream objects to alert them to an ongoing incident.
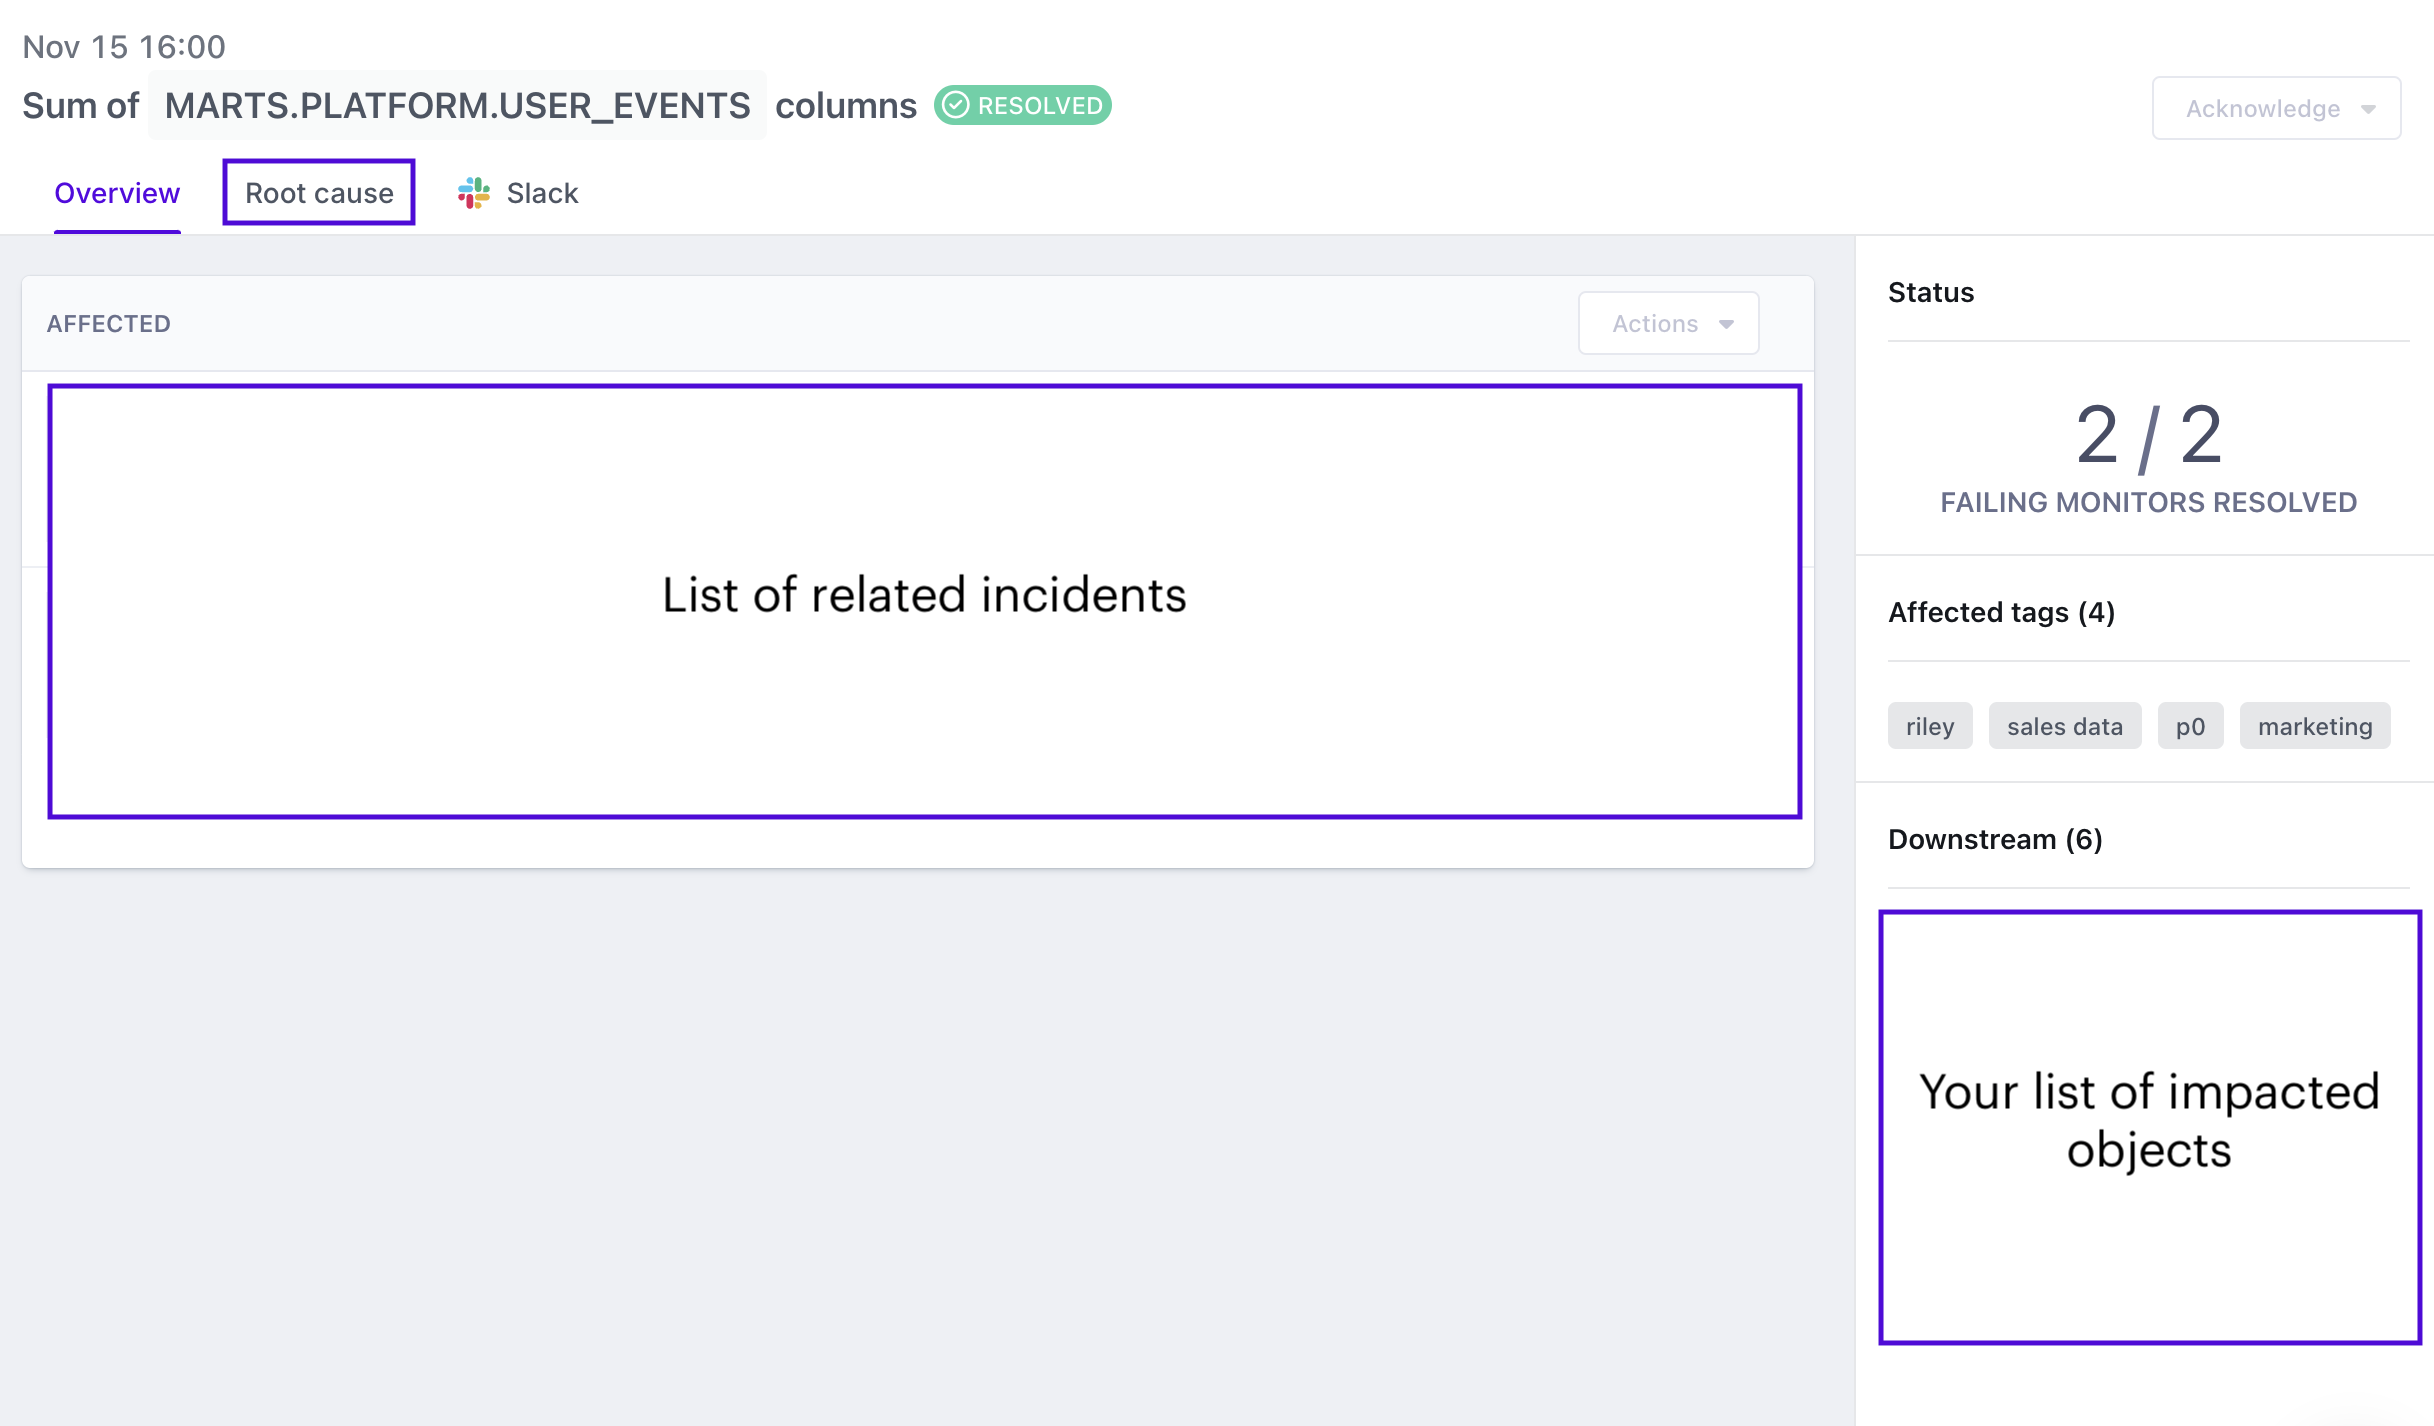
The “Root Cause” tab seen above shows you related queries, pull requests (via Github integration), and other related incidents to help you identify the cause.
-
Go back to the Overview tab and click the table name(s). This will bring up a list of upstream objects that are likely the root cause of an incident if it didn’t originate on your monitored table.
-
(Optional) Use your column level lineage graphs for more detailed exploration.
-
(Optional) Once you’re on the monitor page, if you didn’t set up the monitor, you can use the “Timeline” tab to see any notes from your peers on why the monitor was configured, which should inform your resolution steps.
Updated about 1 year ago